


Blogs
|
Clark Quinn (blog, website, Twitter) recently cited some of my thinking about instructional objectives in the instructional technology forum of AECT (ITFORUM). I wrote a long email to Clark in response, thanking him, and going into more detail. I am reprising my response to Clark here:
In a recent post to this list, Clark Quinn rightly notes that objectives
for learners and objectives for instructional designers need not be identical.
Indeed, as both Clark and I have previously noted, the probably shouldn’t be
identical.
Here’s the thinking: Objectives are designed to guide behavior. So, how
can it be that identically-worded objectives can adequately guide the behavior
of two disparate groups of individuals (learners and instructional designers)?
It just doesn’t make any sense!!
And indeed, Hamilton (1985) found that presenting learners with learning
objectives in the way Mager suggested, PRODUCES NO BENEFITS AND MAY BE HARMFUL.
Here’s what Hamilton wrote:
"[An instructional] objective that generally
identifies the information to be learned in the text will produce robust effects.
Including other information (per Mager’s, 1962, definition) will not
significantly help and it may hinder the effects of the objectives"
(Hamilton, 1985, p. 78).
Objectives are not only designed to change behavior for a particular set
of individuals, but they are also designed with particular purposes in mind—or they
should be.
So, when we talk of instructional objectives, we also need to think
about what purpose we have for them.
The quote above from Hamilton is focused on how well learning objectives
focus the attention of learners. Interestingly, this is the only area in which
extensive research has been done on learning objectives. You might be surprised
to know that learning objectives help learners focus on the information
targeted by learning objectives, but actually diminish their attention on
information in the learning materials not targeted by learning objectives. For
example, in two experiments using specific objectives, Rothkopf and Billington
(1979) found that when focusing objectives were provided to learners, performance
on material related to the objectives improved by 49% and 47% over situations
when focusing objectives were not used. However, the material not related to
the learning objectives was learned 39% and 33% WORSE than it would have been
if no learning objectives were used!
These types of instructional objectives—presented to learners prior to
subsequent learning—I call "focusing objectives" because they are designed for
the purpose of focusing learner attention on critical learning material. As the
Hamilton (1985) review pointed out, it does NOT help to add Mager’s criterion
information to focusing objectives, because it doesn’t help learners focus on
the critical material.
NOW, here’s an important point (I say to focus your attention): We don’t necessarily need to use focusing
objectives with learners if we have other means to focus their attention!! We
can use a relevant, gripping story. We can do a shout-out (example, "Here’s an
important point…"). We can have them attempt to answer a relevant
scenario-based question and struggle with it. Etcetera.
Here’s another important point: Focusing objectives are only one type of
objective we might want to utilize. I have a whole list, and I’m sure you can
think of more of them.
Instructional Objectives for Learners:
Table-of-Contents
Objectives
To give learners a big picture sense of what will be taught.
Performance
Objectives
To let learners know what performance will be expected of them.
Motivation
Objective
To ensure learners know why they might be motivated to engage the learning or
application of the learning.
Focusing
Objective
To guide learner attention to the most critical information in the learning
material.
Instructional Objectives for Developers:
Instructional-Design
Objective
To guide developers toward the ultimate goal of the learning intervention.
Evaluation
Objective
To guide developers (and other stakeholders) to the ultimate measurable
outcomes that the learning intervention will be measured by.
Situation
Objectives
To guide developers to the situations that learners must be prepared for.
Organization ObjectiveTo guide developers to the organizational effects targeted by the
instruction.
Questions:
So, here’s some questions for you:
Is it okay to use the word understand in an "instructional-design
objective"?
How about in a "focusing objective"?
Answer: It’s okay to use the word understand in a focusing objective—because
it does not hurt the learner in setting them up to focus attention on critical
concepts. But it is NOT okay to use the word understand in an
instructional-design objective—because the word "understand" doesn’t have
enough specificity to guide instructional design.
My point in asking these questions is to show that over-simplistic
notions about instructional objectives are likely to be harmful to your
instructional designs.
As usual, the research helps us see things we wouldn’t otherwise have
seen.
Hope this helps!!
= Will
References
Hamilton, R. J. (1985). A framework for the evaluation of
the effectiveness of adjunct questions and objectives. Review of Educational Research, 55, 47-85.
Mager, R. (1962). Preparing
Instructional Objectives. Palo Alto, CA: Fearon Publishers.
Rothkopf, E. Z., & Billington, M. J. (1979). Goal-guided learning
from text: Inferring a descriptive processing model from inspection
times and eye movements. Journal of Educational Psychology, 71(3), 310-327.
Will Thalheimer
.
Blog
.
<span class='date ' tip=''><i class='icon-time'></i> Jul 15, 2015 01:59pm</span>
|
|
We, the members of the workplace learning-and-performance field, think about our field from time to time. Of course we do.
Here's what I wonder. How much have our mental models changed in the last 50 years?
That's too big a question for me to answer right now, but it does raise an interesting question. Today, as I was reading an scientific article (citation below) on how people have insights, the authors reported that, in their study of naturalistic insights, most sudden insights occured when people looked at new data--after having spent a great deal of time before the new data thinking about the issue.
Here's the thing: We, in our field, haven't really created new data sets or methodologies too often. Yes, we have Jack Phillips ROI methodology and Robert Brinkerhoff's Success Case Method--both of which got many of us to rethink what we're doing--but these methods have been at the results end of the causal chain from learning to performance to results. Important stuff--there is no doubt--but not enough.
When it comes to getting new data about learning engagement, remembering, and on-the-job application; we haven't seen much innovation in our field.
If the research on insight is right, then without new data (or new methods to gather data in the case of an industry-wide perspective) we will not have breakthrough insights about how to improve our training and other learning interventions.
We need to continue working toward better data-gathering methods.
I think the Performance-Focused Smile Sheet offers a glimmer of hope, but the recent infatuation with benchmarking does NOT.
What have you done recently to help your company get better data about your learning-and-performance initiatives?
Citation for article that triggered this insight:
Klein,
G., & Jarosz, A. (2011). A naturalistic study of insight. Journal of
Cognitive Engineering and Decision Making, 5(4), 335-351.
Will Thalheimer
.
Blog
.
<span class='date ' tip=''><i class='icon-time'></i> Jul 15, 2015 01:59pm</span>
|
|
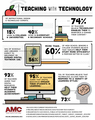
Teaching with Digital Technologies Infographic
Technology has had a huge impact on educating students around the world so it’s no surprise that it is being heavily incorporated into classrooms. From computers to tablets and pretty soon virtual reality field trips, technology has opened the door to possibilities we never could have imagined. The Teaching with Digital Technologies Infographic shows what teachers and students think about the potential of digital technologies in educational setting.
Facts and Stats
74% of teachers believe that technology enables them to reinforce and expand their content.
60% of high school seniors and college students believe that technology helps them study more efficiently and perform better in class.
93% of teachers agree that digital resources help their students academic achievement.
95% of teachers agree that digital resource engage their students in learning.
Both students and teachers are in agreement that technology helps improve the classroom and overall learning environment. At the current rate of expansion, technology may soon revolutionize the educational system as we know it.
View also:
Teaching with Technology Infographic
How Educational Technology is Being Used in the Classroom Infographic
Via: online.annamaria.eduThe post Teaching with Digital Technologies Infographic appeared first on e-Learning Infographics.
eLearning Infographics
.
Blog
.
<span class='date ' tip=''><i class='icon-time'></i> Jul 15, 2015 01:58pm</span>
|
|
As Quincy Jones once remarked, "I’ve always thought that a big laugh is a really loud noise from the soul saying, "Ain’t that the truth."
That said, Edu-fun Friday is a series devoted to adding some humor to the lives of teachers who visit this blog. After all, there’s nothing better than ending the week on a positive note! Plus, do we have the best topics to provide us with some comic relief or what?
Amen! Amen! A-men!
Thanks You Can’t Scare Me, I’m a Teacher Facebook page for sharing this end of the year laugh!
Edutech for Teachers team
.
Blog
.
<span class='date ' tip=''><i class='icon-time'></i> Jul 15, 2015 01:58pm</span>
|
|
The Northern New Jersey ASTD Learning Leaders Forum has invited me to speak at their October 15th meeting. To whet the appetite, we created the following video interview, separated into separate videos.
What research have you found interesting? What's new?
Lessons learned from learning leaders
Five failures of workplace learning professionals
Advice for learning leaders (CLO's, training directors, etc.)
What are you going to speak about on October 15th?
I'd like to send special thanks to Tony Irace--a long-time colleague and a great learning leader--and his co-conspirator at the Northern New Jersey ASTD Learning Leaders Forum, Meg Paradise. Thanks for your interest in my work and for organizing this great event!!
Click here to get the details about the event if you're in the area.
Will Thalheimer
.
Blog
.
<span class='date ' tip=''><i class='icon-time'></i> Jul 15, 2015 01:58pm</span>
|
|
Teens and Media Over the Years Infographic
Being a teenager in 2015 is very different than it was in 1995. Technology has had a huge transformative impact on teen’s behaviour and subsequently their lifestyles. One example in favour of this transformation is social networking. Before the massive uptake of Internet and web 2.0 technologies, kids at the time used to socialize with friends from school or neighbourhood and they got to spend time together in "real world". Now, virtuality takes over and platforms such as Facebook, Snapchat, online gaming sites…etc have redefined the notion of social networking unleashing it from the spatio-temporal boundaries that used to stand in the face of people getting to know and talk to each other.
Technology has opened all kinds of new things to teens, some good and some bad. So just how as being a teenager changed from the 90s? Are things better or worse? Take a look at the Teens and Media Over the Years Infographic above which presents true facts about teens and media and decide for yourself. In particular, the Teens and Media Over the Years Infographic focuses on the social aspect of teen’s lives and reveals some really astounding stats about the increasing dependence of teenagers on social media as the primary means of socialization.
True Facts About Teens and Media, Now & Then
The teens of 1995 were on the forefront of learning to use the internet as part of their everyday lives, today’s teens don’t know how to live without it. They’re focused on finding the latest-and-greatest app that will help them communicate better with their peers. Whereas 60% of teens in 1995 talked to their friends on the phone daily, now only 39% of teens make or receive voice calls at all, while only 35% of teens social with other teens outside of school on a daily basis.
This was partially due to a movement in the mid-2000s in which parents encouraged children to stay inside due to fears of neighborhood safety — not to mention the rapid expansion of the internet. Between 1995 and 2005, the internet grew from 23,500 to 64.8 MILLION websites.
It’s amazing to see how far teens and media have come — and to imagine where they’ll go next.
Via: www.teensafe.comThe post Teens and Media Over the Years Infographic appeared first on e-Learning Infographics.
eLearning Infographics
.
Blog
.
<span class='date ' tip=''><i class='icon-time'></i> Jul 15, 2015 01:58pm</span>
|
|
Wow. What a firestorm! You'd think the U.S. Government was going to go into default or something. Popular Science decides to get rid of its comments--fearing that good science was being misperceived because of online comments.
Here are just a few of the many articles/blogs on the controversy:
NPR Radio Story (Audio)
NPR Online Story
The Guardian article on how some are trying to fix comments
Washington Post article damning comments (read the comments at the end)
The Hindu article praising comments
Slate article on the side of comments
I few quick comments (before I've read the actual science that Popular Science cites and other related research, which, I must add, I find a fascintating topic):
1.If Popular Science is using only one or two studies to draw conclusions, they don't understand social science. Specifically, they don't understand that social science research generally requires--at a minimum--dozens of studies to draw firm conclusions, fence of boundaries, and discover contingencies. Not always, but usually.
2.I agree that society today is getting more and more anti-science, anti-evidence, and anti-wisdom.
3.I agree that there is justification for worrying about the effect of social-media pollution. As a guy who reads over 200 articles from scientific refereed journals on learning, memory, and instruction each year--and thus who probably knows more than the average bear in my field--I've seen lots of categorically-wrong information floated in social-media comments in our field. Of course, I am not infallible, all-knowing, nor omnicient. Anyone who reads the research knows how little of the whole he/she can possibly know. But still, I do know enough to know when some notions of learning are fundamentally flawed. AND in the workplace learning-and-performance field, there is much that is foolhardy, misinformed, and harmful--and social media has not stopped this from happening.
4. There are some victories, however, even if they are not complete. For example, social-media and the internet have made it less likely that people in our field are spouting off about people learning 10% of what they see, etc. Maybe I have made a difference.
5.I know that comments have been helpful to me personally in other contexts. For example, the New York Times comments have been very helpful to me in seeing the strengths and weaknesses of the original article.
6.I got rid of unmoderated comments on my blog purely due to the large amount of spam that was being posted. Most commenters here have helpful things to say.
6.Popular Science argued specifically that people in general are misinformed about science, lending credence to the idea that comments on vetted scientific articles for a popular audience may be a special case.
7.Popular Science also argued (see the NPR interview) that they made the decision because they would rather put their resources into creating good articles in the first place rather than moderating their comment sections.
8.I wish someone who studies this issue intensively would create a rubric, helping us understand when and how comments can be valuable--and when they cause more harm then good. It can't be black and white--comments are good, comments are bad. Most things in human nature don't work like that.
9.For the workplace learning-and-performance field, my recommendation to you is: Don't assume that comments are good or comments are bad. Do assume however, that you may need a way to regulate, monitor, or control comments to make them helpful. I'll never forget the time that I was arguing with a social-media evangelist who was claiming that social media was always corrective in time. A member of the audience interrupted with the story of how social media killed a couple of soldiers when they used information from social-media to attempt to deal with an improvised explosive device.
Some previous posts on social media:
Plusses and Minuses of Social Media
Measuring Social Media
Will Thalheimer
.
Blog
.
<span class='date ' tip=''><i class='icon-time'></i> Jul 15, 2015 01:58pm</span>
|
|
When asked for a simple heuristic in how to use the spacing effect--the
finding that repetitions spaced in time are more effective in
supporting remembering than repetitions squished narrowly in time--I've
often told people that the ideal spacing interval is one that will equal
the retention interval one desires. If you want you learners to
remember for a month, give them one-month spaced repetitions. If you
can't do that, longer is better, and there seems to be something magical
about repeating something overnight.
But new research suggests that even short spacings of only
half-a-minute or so can have lasting benefits over non-spaced
repetitions.
Citation:
Rawson, K. A., & Dunlosky, J. (2012). Relearning Attenuates the Benefits and Costs of Spacing. Journal of Experimental Psychology: General. Advance online publication.
Will Thalheimer
.
Blog
.
<span class='date ' tip=''><i class='icon-time'></i> Jul 15, 2015 01:58pm</span>
|
|
I know I'm going completely against most training-industry practice in saying this, but it's the truth. Likert-like scales create poor data on smile sheets.
If you're using questions on your smile sheets with answer choices such as:
Strongly Agree
Agree
Neither Agree Nor Disagree
Disagree
Strongly Disagree
You're getting data that isn't that useful. Such questions will create
data that your stakeholders--and you too--won't be able to decipher very
well. What does it mean if we average a 4.2 rating? It may sound good,
but it doesn't give your learners, your stakeholders, or your team much
information to decide what to do.
Moreover, let's remember that our learners are making decisions with every smile-sheet question they answer. It's a lot tougher to decide between "Strongly Agree" and "Agree" than between two more-concrete answer choices.
Sharon Shrock
and Bill Coscarelli, authors of the classic text, now in its third edition, Criterion-Referenced Test Development,
offer the following wisdom: On using Likert-type
Descriptive Scales (of the kind that use response words such as "Agree,"
"Strongly Agree," etc.):
"…the
resulting scale is deficient in that the [response words] are open to many
interpretations." (p. 188)
So why do so many surveys use Likert-like scales? Answer: It's easy, it's tradition, and surveys have psychometric advantages often because they are repeating the same concepts in multiple items and they are looking to compare one category to another category of response.
Smile sheets are different. On our smile sheets, we want the learners to be able to make good decisions, and we want to send clear messages about what they have decided. Anything that fuzzes that up, hurts the validity of the smile-sheet data.
Will Thalheimer
.
Blog
.
<span class='date ' tip=''><i class='icon-time'></i> Jul 15, 2015 01:57pm</span>
|
|
Looking for some interesting K-12 edtech data? Then look no further than the New Digital Learning Playbook, Project Tomorrow’s annual Speak Up National Research Project which provides districts nationwide and throughout the globe with new insights into how today’s students want to leverage digital tools for learning.
In fall 2013, over 403,000 online surveys from K-12 students, parents, and educators representing over 9,005 U.S. schools were used to establish a more comprehensive understanding of the various ways students are currently tapping into a wide range of mobile devices to enhance learning anytime, anywhere.
Check out the infographic shown below to see how mobile devices enable new and customized learning that is un-tethered and digitally-rich.
A full page version of this infographic can be found here.
Classroom Connection:
Educators are always looking for data to support the value of digital tools related to the learning process. The findings provided in this infographic (and corresponding report) provide additional rationale to support the integration of technology into classrooms and beyond.
A shout out to my colleague Jim Gates for sharing this valuable edtech info!
Edutech for Teachers team
.
Blog
.
<span class='date ' tip=''><i class='icon-time'></i> Jul 15, 2015 01:57pm</span>
|