


Blogs
|
The Ultimate Guide to UK Universities Infographic
The Ultimate Guide to UK Universities Infographic serves as a comprehensive guide to higher education in the United Kingdom, featuring intriguing statistics and solid advice on how to apply.
Top 10 Application Tips
1. Make contacts.
Get to know key people at the universities you’re applying to before making your submission. Find out who the course leaders and academic staff are, ask them questions via email or follow them on social media to start up a dialogue and show your interest.
2. Grab their interest from the beginning.
When it comes to actually writing your personal statement, be sure to make the first paragraph arresting. Like a newspaper article, it should grab the reader’s attention from the get-go.
3. Give lofts of examples.
Don’t just make sweeping statements such as, ‘I find history fascinating.’ Expand on this by giving examples that prove how much you love the subject.
4. Make if personal.
Don’t try and use lots of big academic words to try and make yourself sound clever, keep it simple. And explain exactly why the course interests you personally.
5. Choose referees carefully.
Your application will also come with letters of recommendation. Your referees should be individuals who know you and your abilities in great depth. They should be able to give lots of examples of where your strengths lie.
6. Practice and proofread.
Do a few drafts of your application before submitting the final piece. Ask your advisors/teachers for advice along the way. Be sure to check for spelling/grammatical errors afterwards.
7. Include relevant extra-curriculars.
When including your hobbies or extra-curricular activities make sure they’re relevant to the course you’re applying for. Explain the skills you have developed through such and how they compliment the field of study.
8. Sell yourself.
Tell the reader why you would make a superb addition to the university. Don’t be too egotistical however and definitely don’t lie, because liars always get found out.
9. Think about structure.
Plan your application in advance to ensure a good structure. Make sure the piece flows well, is clear and concise.
10. Don’t miss deadlines.
Make a note of all deadlines in your diary so that you don’t miss one. If your application arrives late it will look like you’re not really bothered about getting a place at the university.
Via: essaywritingserviceuk.co.ukThe post The Ultimate Guide to UK Universities Infographic appeared first on e-Learning Infographics.
eLearning Infographics
.
Blog
.
<span class='date ' tip=''><i class='icon-time'></i> Jul 15, 2015 03:49pm</span>
|
|
How to Create Engaging Presentations Infographic
If you subscribe to news feeds or have friends who love to share information found online, you’ve likely seen some fresh, thought-provoking PowerPoint presentations. While some are traditional, and others are trend-setting, they share a common factor that makes them great - the ability to convey a message to make a powerful "point" quickly, concisely, and memorably. In a nutshell, a great presentation sells a concept, doing so in a way that grips and holds your attention.
The rise of slides as an extremely effective internet communication medium has not gone unrecognized by groups such as Microsoft and PowerPoint and hosting company SlideShare, who award honors each year to standouts. The How to Create Engaging Presentations Infographic provides tips on how to create a presentation that will not put your audience to sleep.
Via: blog.udemy.comThe post How to Create Engaging Presentations Infographic appeared first on e-Learning Infographics.
eLearning Infographics
.
Blog
.
<span class='date ' tip=''><i class='icon-time'></i> Jul 15, 2015 03:49pm</span>
|
|
Popular Learning Evaluation Models Infographic
Learning is an investment and like any investment, it’s crucial to measure the outcomes. But because learning is often so intangible and individual, that measurement is often pretty tough. It’s not like working out how much money you saved by swapping the office over to energy-saving lightbulbs - there are a whole host of factors to consider. Learning is a journey with a destination, not a one-off event. There are lots of different evaluation methods out there. The Popular Learning Evaluation Models Infographic is a quick guide to some of the most popular.
Kirkpatrick’s Model of Training Evaluation
Level Four−Results: To what degree targeted outcomes occur, as a result of learning event(s) and subsequent reinforcement.
Level Three−Behaviour: To what degree participants apply what they learned during training when they are back on the job and attitudes based on their participation in the learning event
Level Two−Learning: To what degree participants acquire the intended knowledge, skills.
Level One−Reaction: To what degree participantsreact favourablyto the learning event.
Phillips’ Evaluation Model
Based on Kirkpatrick’s model. It adds a fifth step, ROI, which is calculated using this seven-stage process.
Collecting Pre Programme Data
Collecting Post Programme Data
Isolating The Effects of the Program
Converting Data to Monetary Value
Tabulating Program Costs
Calculating Return on Investment
Identifying Intangible Benefits
Brinkerhoff’s Success Case Method
Brinkerhoff’s model focuses on narratives and stories, supported by evidence:
Identify the goals of the learning opportunity and connect them to business needs.
Survey participants to identify best and worst cases.
Obtain corroborating evidence.
Analyze the data.
Communicate findings.
CIRO Evaluation Model
Context: Identifying training needs and objectives.
Input: Designing and delivering training.
Reaction: Quality of trainee experience.
Outcome:
- Immediate - individual changes before returning to work
- Intermediate - individual transferring changes to work
- Ultimate - departmental or organisational results
Scriven’s Key Evaluation Checklist
Mainly for evaluating programs and policies and evaluations of them.
Preliminaries
1. Executive summary
2. Preface
3. Methodology
Foundations
- Background and context
- Descriptions and definitions
- Consumers
- Resources
- Values
Sub-Evaluations
- Process evaluation
- Outcome evaluation
- Comparative cost-effectiveness
- Exportability
- Overall significance
Conclusions
- Recommendations and explanations
- Responsibilities
- Reporting and follow-up
- Meta-evaluation
Read also the Little Book of Impact by Reed Learning which is full of ways to help you become a learning superhero, with top advice from L&D’s best-known thinkers and Reed Learning’s experts. Reed Learning created this book in partnership with some of the leading thinkers in the L&D industry - including Training Journal, The Kite Foundation, the ASTD, Kirkpatrick Partners and many, many more. Inside you’ll discover jargon demystified, what best practice looks like and some innovative ideas to guide your own learning programmes
Via: www.reedlearning.comThe post Popular Learning Evaluation Models Infographic appeared first on e-Learning Infographics.
eLearning Infographics
.
Blog
.
<span class='date ' tip=''><i class='icon-time'></i> Jul 15, 2015 03:48pm</span>
|
|
Learning in a Multi-Device World Infographic
We live and work in a multi-device world that allows us access to knowledge at our fingertips. In the learning world this has created a new dimension, which lays emphasis on multi-device/responsive learning. The Learning in a Multi-device World Infographic provides a graphical explanation on the rapid rise in the number of devices and their increased usage in our daily lives that have led to the evolution of ‘The Multi-device World’. It also explains the need for multi-device learning in the present scenario and provides an elucidation on the various aspects pertaining to designing, testing and delivering that have to be considered when getting started with multi-device learning.
Multi-device world and multi-device learning
In 2012, Google’s study, titled ‘The New Multi-screen World: Understanding Cross-platform Consumer Behavior‘ gave us a glimpse of the multi-device world. It claimed we were using multiple devices in a day, often switching between them to complete tasks. Today that phenomenon is only getting stronger.
According to the Verto Analytics’ Device Ecosystem US 2014 report, the average number of smartphones, tablets and computers used by an average US adult is 2.8 devices. Further, consumers show an increasingly polarised preference towards a particular device and platform as technology evolves. This indicates the increasing dependency on devices, generated by the ease in switching between tasks and the leverage it provides.
In line with this, we have been talking about designing and testing learning that can be seamlessly delivered across all devices. Learning solutions need to be comprehensive and available anytime, anywhere and on any device. As a result, learning solutions providers need to be designing and developing a learning environment that is responsive and can be seamlessly delivered to the learners, and make ‘Learning a lifestyle’.
Via: www.upsidelearning.comThe post Learning in a Multi-Device World Infographic appeared first on e-Learning Infographics.
eLearning Infographics
.
Blog
.
<span class='date ' tip=''><i class='icon-time'></i> Jul 15, 2015 03:48pm</span>
|
|
Millennials in the Workplace Infographic
The Millennials in the Workplace Infographic explores Millennials’ values and expectations, personally and professionally. Lazy. Narcissistic. Entitled. These are just a few of the stereotypes often associated with Millennials. But just how true are these assessments? According to Michigan State University, despite assumptions generally made about Generation Y, an examination of high-school seniors in the U.S. from 1976 to 2006 revealed that there actually hasn’t been much change in qualities such as individualism and egoism compared to previous generations.
So what are some defining characteristics of Millennials? TIME Magazine calls out a few that were noted by a 2012 MTV study : in a world of Facebook and texting, Millennials, or those born between 1977 and 1997, are tech savvy, collaborative, entrepreneurial, and hyper-connected. They’re even more likely than other generations to attend online schools.
But how do these qualities translate to the workplace? TIME noted that Gen Y-ers prefer fast-paced jobs without the conventional corporate hierarchy and flexibility in setting their own work hours. They’re an impatient generation, possibly stemming from the real-time responses they’re used to getting across social media and with technology in general.
One can see how the typical millennial stereotypes came about. The Huffington Post noted that according to the MTV study, 71% of Millennials think they are "too talented to punch a clock or sit in a cubicle," and they also believe that experience isn’t a prerequisite to bright ideas. While this may come across as entitlement or egoism, millennial workers really just want to hit the ground running and clearly see the impact their work makes to the company’s bottom line. These beliefs are what drive so many Millennials to pursue entrepreneurship and build businesses such as Google and Facebook.
As TIME Magazine pointed out, by 2025, Millennials will comprise 75 percent of the global workplace. Over time, they are "reshaping today’s consumer and media markets," according to MTV’s Senior Vice President Nick Shore, and eventually, they will also have reshaped the workplace.
Please consult the visual for a full list of sources.
Via: www.onlineschools.comThe post Millennials in the Workplace Infographic appeared first on e-Learning Infographics.
eLearning Infographics
.
Blog
.
<span class='date ' tip=''><i class='icon-time'></i> Jul 15, 2015 03:47pm</span>
|
|
Eccentric Habits of Tech Geniuses Infographic
It’s often true that genius and madness are often two sides of the same coin, so it shouldn’t surprise you that the elite figures of the technology world all have their own eccentric habits and hobbies.The Eccentric Habits of Tech Geniuses Infographic presents a few of the ways that the tech elite keep themselves inspired.
Bill Gates
Who they are: Founder and technology advisor of Microsoft
Habit: Generates high-tech ideas using an analogue whiteboard.
Quote: "I always have nice color pens, and it’s great for brainstorming when I’m with other people, and even sometimes by myself."
Yoshiiro Nakamatsu ("Dr. NakaMats")
Who they are: Inventor of the floppy disk.
Habit: Relaxes each evening in his 24-karat gold-tiled "Calm Room".
Quote: "The gold blocks out radio waves and television signals that are harmful to imagination."
Jeff Bezos
Who they are: CEO of Amazon
Habit: Thinks ahead.
Quote: "Working backwards… demands that we acquire new competencies and exercise new muscles, never mind how uncomfortable and awkward-feeling those first steps might be."
Nikola Tesla
Who they are: Inventor of the AC electric system
Habit: Practiced carefully- considered moderation in smoking, drinking and eating.
Quote: "Most persons are so absorbed in the contemplation of the outside world that they are wholly oblivious to what is passing on within themselves."
John Havens
Who they are: Founder of the H(app)athon Project
Habit: Analyses data using gadgets and apps to better understand the mechanics of happiness.
Quote: "Rather than guess at how you felt a week or a month ago, you can record aspects of your mood or health to help optimize your well-being in the future."
Anna Akbari
Who they are: Founder of sociologyofstyle.com
Habit: Eats the same breakfast and lunch every day.
Quote: "More choices require time and energy and shift our focus away from other things that matter. More choices also breed a sense of anxiety about making the "right" choice."
Joel Gascoigne
Who they are: Founder and CEO of Buffer
Habit: Will make decisions without complete certainty.
Quote: "One useful thing to do is remind yourself that whilst history has some rhythms, it never repeats itself. Even the most experienced entrepreneurs have to assess things with a fresh mind when they embark on a new venture."
Kevin Systrom
Who they are: Co-founder of Instagram
Habit: Still loves taking photos.
Quote: "I grew up as a photo nut. Every Christmas I would get a new camera. It’s a huge part of my life."
Mark Zuckerberg
Who they are: Founder and CEO of Facebook
Habit: Takes up new challenge each year - from learning Chinese to only eating meat he personally killed.
Quote: "I spend almost all of my time building Facebook, so these personal challenges are all things I wouldn’t normally have the chance to do if I didn’t take the time."
Shigeru Miyamoto
Who they are: Legendary games designer at Nintendo
Habit: Measures things.
Quote: "I’ve always enjoyed guessing the lengths of objects, which is why I carry a measuring tape around with me."
Steve Jobs
Who they are: Inventor, late CEO of Apple
Habit: Listens to music.
Quote: "If you’re trying to design a computer you will literally immerse yourself in the thousands of details necessary; all of a sudden, as the scaffolding gets set up high enough, it will all become clearer and clearer and that’s when the breakthrough starts. It is a rhythmic experience, or it is an experience where everything’s related to everything else and it’s all intertwined. And it’s such a fragile, delicate experience that it’s very much like music."
So there you have it, the eccentric habits of the tech elite. While we wouldn’t advise that you start carrying around a tape measure - or bankrupt yourself building a 24-karat gold-tiled ‘Calm Room’ - you can’t argue with the results.
Via: www.whoishostingthis.comThe post Eccentric Habits of Tech Geniuses Infographic appeared first on e-Learning Infographics.
eLearning Infographics
.
Blog
.
<span class='date ' tip=''><i class='icon-time'></i> Jul 15, 2015 03:47pm</span>
|
|
Today, e-learning is an integral component for training delivery in organizations worldwide. It has revolutionised the way learners learn and with its delivery extended to support tablets and smartphones, we will see a bigger focus on e-learning in corporate learning strategies.
There are several advantages that e-learning brings in and organizations are seeking ways to determine the Return On Investment (ROI) that can clearly establish the gains they will accrue. This article outlines what ROI is, how it can be computed and more specifically, how it can be increased.
Why is eLearning adopted?
Over the last two decades, most organizations have made investments in eLearning primarily for the following benefits:
Anytime, anywhere access (on demand availability)
Self-paced, interactive and more engaging learning (learner perspective)
Less disruptive delivery (in contrast to ILT)
Cost-effective (particularly when reaching out to a large audience)
Consistency of message and easy updation of content
Easy tracking of learner progress and completion (business perspective)
What is ROI?
ROI is the return on investment that an organization makes (ROI = Gain or Return/Cost). It can be determined through two factors namely the Investment made (or cost incurred) and Value/Gain accrued(or return).
A successful e-learning initiative should be able to demonstrate gains that are more than the investment.
How to determine costs and assess returns?
Costs are fairly easy to define and would normally include the cost of e-learning course development as well as associated costs of team members (including teams that are associated with the development process and Subject Matter Experts)
Typically, there would also be associated cost of the supporting delivery (LMS, Administrative cost of managing the initiative and other related infrastructure required for delivery)
Determining the "value" or "gain" is far more tricky. We nail this by looking at the gains for the organization as well as for the learners.
Organizational perspective
Let us begin by re-looking at the gains most organizations seek when they adopt e-learning and see how many of these translate to reduction in costs and hence improvement in returns.
Less disruptive delivery: This translates to man-days available now to the organization that would have been allocated to travel and training in the ILT mode.
Reduced travel costs: These can be determined easily.
No associated costs for trainers: These can be identified easily
Learners’ perspective
Next, let us look at the gains that accrue on account of effective e-learning course designs:
Immersive and engaging learning translates to better assimilation. This in turn leads to proficiency gain and a tangible increase in productivity.
More learners across the organization can be trained in lesser time (while they get the flexibility to learn at their own pace).
Coupled with tracking, the e-learning initiatives can be scheduled and completed faster as compared to ILT sessions.
What ROI methodology can be used?
Most of us are familiar with Kirkpatrick’s model of evaluation. In today’s context, adding Phillips’ ROI calculation as the fifth level makes this framework even more useful and relevant.
By using Level IV evaluation data, we can convert the results into monetary value. Then we can easily compare them against the cost of the e-learning program and determine the ROI.
To give you a sense of how it can be practically used, let me summarise the approaches we typically adopt:
Level 1: Reaction is measured by taking feedback from learners. We have used online surveys in the past but now we add features of "Like the course" and "Recommend the course" options within our e-learning course framework.
Level 2: Learning can be easily measured through scoring patterns in the end of course assessments.
Level 3: Behavioural changes are certainly more difficult to assess. We use a combination of techniques to assess how much of the newly acquired learning is being applied on the job. This could be measured through improvements in efficiency or doing the same task with a new approach.
Level 4: Business impact is generally measured through productivity gain, impact on quality measures through reduction in re-works, getting higher number of work assets first time right and so on.
Level 5: ROI is normally calculated by converting the business impact gains (as shown in level 4) to a monetary value.
How can you maximise the ROI?
Here are some best practices that can help you maximise your ROI:
Selecting right courses for e-learning: To begin with, it is a good idea to take time to do a detailed Training Needs Analysis and Competency Mapping exercise, which will help scope the learning gaps and possible options clearly. You need to choose e-learning projects that are significant and the identified proficiency gains must have a clear impact on the business.
Efficacy of the e-learning program: Once you have selected the project that has high-leverage, the focus moves to creating courses that are effective. This needs a strong Learning Design core that Instructional Design brings in. The learning experience must be engaging and immersive with the focus of the course being a combination of Learn, Explore and Test.
Assessment strategy: You must have an effective assessment strategy to help you evaluate if the training met the required cognition level and was indeed able to bridge the identified gap.
Push the envelope to knowledge application (rather than knowledge acquisition):A great way to achieve this is by using Performance Support Tools (PSTs) that can complement or supplement the e-learning program. These just-in-time learning aidscan be provided to the learners at their workplace and within their workflow. (They could contain Checklists, Ready-Reckoners, Read-This-First or Simple tips, Best practices and so on).
Provide platform for collaboration in learning:Research shows that nearly 20% of our learning happens from feedback and from observing our co-workers (peers, seniors or role models). It is interesting to note that only 10% of learning happens through formal training. Providing platforms for social or informal learning will facilitate learning and can also be used to create live case studies of success.
While training budgets remain a constant concern for organizations, the onus is on L&D and e-learning professionals to justify the investments made in eLearning.
I believe that except for mandatory programs like Compliance, we can demonstrate the positive impact on business on account of e-learning initiatives by crafting learning that is assimilated fast and can be easily applied on the job. In my next article, I will outline how intervention of Performance Support Tools (in conjunction with e-learning) can help organizations achieve this and improve their ROI on e-learning.The post Return On Investment (ROI): Are you in? appeared first on EI Design.
EI Design
.
Blog
.
<span class='date ' tip=''><i class='icon-time'></i> Jul 15, 2015 03:44pm</span>
|
|
What are Performance Support Tools (PSTs)?
Organisations worldwide face the dual challenge of enhancing performance and increasing productivity. Clearly, learning and performance gain are inter-linked. On account of this, L&D professionals are on the lookout for measures that can increase application of learning at work.
Training has long been the traditional approach to improve performance.E-learning in particular has been extremely effective in providing this "anytime-anywhere" support to learners. However, formal training is often not enough to ensure that the acquired learning indeed gets applied at work.
This is exactly where PSTs fit in. These are just-in-time learning aids that are available to learners within their workflow.
How are PSTs different from trainings?
As we know, trainings are designed after carrying out the Training Needs Analysis (TNA) and identifying a need or gap. They are structured to meet the defined objectives and provide people to pick up or master a specific knowledge and skill. Trainings can be rendered in a classroom or online. In contrast, PSTs are just-in-time learning aids that help people accomplish tasks so we are not looking at learning objectives but support to get the work done. Unlike trainings, they are not disruptive and are available to learners within their workflow.
When exactly would the learners need Performance Support?
Designed by Dr. Conrad Gottfredson, a leading expert on Performance Support, the Five Moments of Need© is a very effective framework that can be used to map varied learning and performance support needs in any organisation.
According to him, learners seek support in "Five Moments of Need" as indicated here:
When they are learning an aspect for the first time
When they want to deep-dive and learn more
When they want to apply or remember something
When they need to solve a problem or fix something that has gone wrong
When something changes
If you review this model "Five Moments of Need", a couple of important aspects emerge. The first two moments focus on knowledge acquisition and hence map to formal training (classroom or online). On the other hand, the next three moments focus more on Performance Support. They are aligned to help learners apply their knowledge within their workflow.
So, an effective learning and performance strategy must factor for both measures that are necessary to acquire learning (through formal training) and more significantly, apply this learning (through Performance Support intervention).
On account of this, an effective Performance Support Solution will have a direct bearing on the gains for business; thereby impacting the ROI on E-learning positively.
How do PSTs improve application of learning?
Unlike formal training that tends to be disruptive (pulls the learner away from work), PSTs can be easily embedded in the learners’ workflow. The key is that they provide the right amount of support and guidance that the learners need at work (and within their workflow). These can be provided in varied, interesting formats ranging from Mobile Apps to eBooks, Interactive videos, eBooks or Interactive PDFs.
The typical PSTs focus on checklists, ready reckoners, guidelines and so on and can be designed to complement or support formal training. They can also be provided as stand-alone learning aids focusing on performance enhancement. The key is that these aids are available to learners exactly "when and where they need" it.
A case study
Let us look at a case study that illustrates how a PST (as a checklist) that complemented an online course enhanced the application of learning.
Audience: Instructional Designers
Formal training: An online course on "Writing Effective Storyboards"
PST: A "checklist" summarising the workflow to be followed and the key aspects to conform to during storyboarding available as avideo featuring Kinetic text/Text animation
Outcomes of the online course
The aim of the course is to ensure that the learners imbibe the basics of storyboarding and gain an insight about the key focus areas of a storyboard creation.
The gaps (in application)
When we rolled out these courses to our internal Instructional Design team, we found that the conformance to the prescribed workflow to develop storyboards was rather patchy. Since the team had individuals with varied backgrounds and with different proficiency levels, they tended to use individual approaches that they were most comfortable with. We needed to ascertain how we could instill the discipline of following the prescribed approach.
How did we bridge the gap?
We developed a PST (a micro learning object) that served as a "checklist" for the Instructional Designers. This just-in-time learning aid was designed as a video featuring Kinetic text/Text animation with audio that provided a precise and sharp input on the workflow to be followed.
The impact
The checklist is now available to our Instructional Designers on their desktops/laptops as well as tablets/smartphones. Access to this aid within their workflow increased their probability of using them and applying them at work. We see an increased focus in conformance to the mandate now.
The business impact is on account of gains due to:
Improvement in "first time quality"
Reduction of review time
Reduction in time to turn-around each storyboard
How can PSTs improve ROI in E-learning?
As we saw in the case study, having an effective training program is often not enough to meet the organisational mandates of enhancing productivity and reducing errors. Using Performance Support to complement or supplement formal training will certainly impact the "returns" for the organisation positively and increase the ROI on E-learning. There would be a direct gain on account of competence gain that will translate to higher performance and productivity levels (as compared to training alone).
It is important to note that Performance Support may not generate all the "returns" but is an extremely effective contributor in enhancing them and improving the ROI on E-learning.The post Improve ROI of your E-learning solution through Performance Support Tools appeared first on EI Design.
EI Design
.
Blog
.
<span class='date ' tip=''><i class='icon-time'></i> Jul 15, 2015 03:44pm</span>
|
|
Microsoft’s Impact on Education Infographic
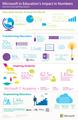
From teachers and school leaders to governments and communities around the globe, a massive effort is underway to modernize and transform education. This transformation is a long journey, full of unexpected twists and turns, lessons learned and best practices. Microsoft is partnering with schools and campuses that are working to transform and modernize teaching so that students are inspired to learn and are prepared for their next steps. Microsoft is also making sure that educators are empowered with effective technology. Take a look at The Microsoft’s Impact on Education Infographic above for complete details about the impact Microsoft is trying to make on the education sector by offering various of its services and products at attractive discounts for students and teachers alike — apart from the partnerships and programs it conducts.
Microsoft’s Impact on Education
Today, over 20 million students in 55 countries have digital access through partnerships with Microsoft. Over 110 million students and teachers are using Office 365 at school and at home to create, collaborate and communicate. And nearly 1.5 million educators from 235 countries are members of the Microsoft Educator Network, giving them a unique opportunity to share best practices, and to learn from their colleagues’ successes — as well as their mistakes.
In spite of undeniable progress, more than 72 million children around the world remain unschooled. This statistic is even more troubling when you consider that global youth unemployment stands at a staggering 13 percent.
At Microsoft, they have an ambitious company-wide commitment to create opportunities for 300 million young people. In addition to our widely-used software and hardware, programs like YouthSpark have helped over 227 million youth in over 100 counties since it launched in 2012. And, over 1.65 million students have taken the Imagine Cup challenge to solve the world’s toughest problems with innovative technology.
Creating a better future for today’s young people is a long-term commitment Microsoft is vested in alongside teachers and school leaders who come to school each day to make a difference. Microsoft stands alongside those educators, with the very same objectives. At Microsoft, they believe that every child deserves a quality education, and through our products, services and programs, they are working to make that happen. The numbers speak for themselves.
View also:
Microsoft in Education Infographic
Via: blogs.technet.comThe post Microsoft’s Impact on Education Infographic appeared first on e-Learning Infographics.
eLearning Infographics
.
Blog
.
<span class='date ' tip=''><i class='icon-time'></i> Jul 15, 2015 03:44pm</span>
|
|
History of Computer Aided Language Learning Infographic
Contrary to popular opinion, using technology is not a new phenomenon within the English Language Teaching (ELT) world. The History of Computer Aided Language Learning Infographic is a brief timeline of how technology is being used for language learning over time.
Behaviourist CALL (1950s - 1970s)
Conceived in the 1950s and implemented in the 19605s and 1970s, the computer played the role of tutor, serving mainly as a vehicle for delivering instructional materials to the learner. Drill- and-practice programs were a prominent feature of this phase.
Communicative CALL (1970 - 1980s)
In this phase, which became prominent in the 1970s and 1980s, the computer continued to be used as a vehicle for practising language skills, but in a non-drill format and with a greater degree of student choice, control and interaction.
Integrative CALL (1980s)
This phase was marked by the introduction of two important innovations:
1. Multimedia: The introduction of multimedia CALL meant that reading, writing, speaking and listening could be combined in a single activity, with the learner exercising a high degree of control over the path that he/she follows through the learning materials
2. Internet: Built on multimedia technology and in addition enabling both asynchronous and synchronous communication between learners and teachers.
World Wide Web (1997)
The World Wide Web, a subsect of the Internet is founded. A range of new tasks became possible, e.g. Web searches, Web concordancing, and collaborative writing.
Data Driven Learning (1997)
New approach to language teaching that was cited by Levy (1997) survey respondents as a direct result of the attributes of the computer. In other words, this approach has been conceived with the computer in mind.
Now
Blogs, Wikis and Social Media
MOOCs and Distance Learning
Mobile/Web Applications
View also:
English Language Learning and Online Education Infographic
Language Learning Goes Digital Infographic
Via: wearee3.comThe post History of Computer Aided Language Learning Infographic appeared first on e-Learning Infographics.
eLearning Infographics
.
Blog
.
<span class='date ' tip=''><i class='icon-time'></i> Jul 15, 2015 03:44pm</span>
|