


Blogs
|
How Technology Transforms Classrooms Infographic
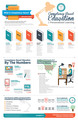
Technology has changed the way we operate in our day-to-day lives. From driving to work to cooking in the kitchen, from the way we do research to the ways we entertain ourselves, all of us are affected by technology. The classroom has not been exempt from changes in technology. The How Technology Transforms Classrooms Infographic shows ways in which technology can help students and teachers, both inside and outside of the classroom.
1. Increased Technology Use
As of 2009, the National Center for Education Statistics with the Department of Education report that
97% of teachers having at least one computer in their classroom.
93% of computers located in the classroom have Internet access for student and teacher use.
the student to computer ratio in schools is 5.3 to one.
Teaching Benefits
Teachers and students are both finding that increased technology availability and use are producing positive outcomes in the learning environment. For teachers in the Pre-K to 12th grade range, 74% say technology has helped them reinforce and expand the content they are teaching. Nearly two-thirds of teachers say that the use of technology in the classroom allows them to show something they are not able to demonstrate in a different way. However, only about half of teachers report using technology for online lesson planning. About half of all teachers allow students to access web-based educational games and activities for learning in the classroom.
Advanced Placement, National Writing Project Classes and Technology
Technology is being used in the classroom and making a difference. In fact, 92% of Advanced Placement and National Writing Project educators report that the Internet has a "major impact" on their ability to easily access learning content, resources, and materials. In the same groups of teachers, 73% also state that they or their students use mobile devices to complete assignments inside of the classroom.
Student Writing and Technology
According to majority of students and teachers, digital technologies allow students to share their writing abilities and work with a wider and more varied audience. In fact, 52% strongly agree with that statement. In addition, 79% of writing students agree that tools in technology encourage greater collaboration with other students. Digital technology also encourages student creativity and personal expression, according to 78% of students.
2. Mobile Devices
According to recent studies, mobile devices also have many benefits in the classroom. These benefits include reducing the amount of paper used by students, helping absent students keep up with their missed work, engaging more students and on a higher level, and apps that cover a wide age-range, learning styles, and many different topics. In fact, schools in the United States were slated to buy more than 3.5 million tablets at by the end of 2014. By the end of 2015, it is projected that 45 states will be testing via electronic devices. This is due, in part, to the transition to the Common Core curriculum.
Mobile Apps
Some initial testing shows that students who use apps perform better than those who do traditional textbook learning. Apps are also available for smart phones and tablets that give homework reminders and to help track the progress on assignments and projects.
Homework use
Almost a third of students surveyed reported using a tablet for homework, while 65% reported using a laptop for homework. Furthermore, 39% of 14 year olds reported using a smart phone to complete their homework, 42% of 6th graders used them, while 57% of 8th graders did the same.
3. Flipped Classrooms
Technology is also changing the way students and teachers receive, process, and use information to meet learning goals and standards. Instead of traditionally hearing a lecture while at school and then doing homework to complete an activity based on the lecture, the process is now changed. Students watch a short recorded video lecture as their homework. Then they come to class and get help with projects or activities, or take an exam. For students who struggle with learning, this new process allows them to truly learn information, not simply memorize it.
4. Creative Homework Approaches
Connecting Parents Online
Another benefit to technology in the classroom is that parents can be more involved. Many schools have an interface or learning management system in place that allows parents to view homework assignments and their own child’s progress.
Integrating Social Media
Social media can also help students think outside the box when it comes to learning. Many teachers have also let their students design their own homework and have more involved assignments with the help of technology.
Via: mastersed.uc.eduThe post How Technology Transforms Classrooms Infographic appeared first on e-Learning Infographics.
eLearning Infographics
.
Blog
.
<span class='date ' tip=''><i class='icon-time'></i> Jul 15, 2015 03:35pm</span>
|
|
How to Maximize the EdCamp Experience Infographic
The How to Maximize the EdCamp Experience Infographic provides some useful tips for new and experienced EdCampers!
Prepare for EdCamp the day before (or earlier)!
The day or night before, prepare for the event so you are ready to maximize your learning and your experience!
Charge your devices.
Bring at least two devices so you have a backup when your battery runs low. Sometimes power outlets can be inconvenient, and you don’t want to be tethered to a wall and miss something awesome!
Prepare your social media accounts
Every EdCamp will have its own official hashtag (i.e. #EdCampAwesome). If you are already on social media, especially Twitter, go ahead and save the hashtag in the Twitter application of your choice. Add a new column in Tweet Deck or Hootsuite, or your favorite app to follow the hashtag and start the collaboration early! Check out who is already tweeting with the hashtag, who will be there, and share your own post to let others know you are coming.
The Day of EdCamp
Prepare for your day of learning and collaboration!
Arrive early!
Be sure to arrive early to make the most of the networking time! Meet and collaborate with as many educators as you can. Look for Twitter handles on attendee name badges so you can expand your PLN and follow them on Twitter.
You also want to have plenty of time to suggest topics for sessions. If you have never used Twitter, be sure to suggest it and ask for it to be in the first block. That way Twitter newbies can learn and practice their new Twitter skills all day! Be brave and put your name on a topic to facilitate! Any teacher can facilitate a discussion. You do not have to be the expert.
Tweet Often!
Twitter can really enrich the EdCamp experience! Be sure to share what you learn on Twitter. Favorite the tweets of others you want to come back to, and let Twitter serve as some of your note-taking. EdCampers across the globe follow the hashtags to learn along with you. Who knows, you might inspire the next EdCamp!
Take collaborative notes
Use Google Slides. This is a great way to take collaborative notes for conferences and EdCamps. One person will create and share publicly a Google Slides presentation. Then participants create a new slide and add notes for each session they attend. At the end of the event you have everything in one share presentation!
Stay late
Most EdCamps have lots of fun door prizes that are given away throughout the day, or at the end of the day. You don’t want to miss out on a free iPad or Chromebook! Not to mention, you will want to stay late to continue the collaboration and networking. Keep learning, expanding your PLN, make the most of the EdCamp experience!
Via: www.shakeuplearning.comThe post How to Maximize the EdCamp Experience Infographic appeared first on e-Learning Infographics.
eLearning Infographics
.
Blog
.
<span class='date ' tip=''><i class='icon-time'></i> Jul 15, 2015 03:34pm</span>
|
|
How to Deal With Exam Anxiety Infographic
When it comes to coping with exam stress I’m sure you feel that you’re suffering on your own. It’s worth knowing then that you aren’t alone and that millions of students each year find successful and effective ways to overcome their exam worries and fears. After all, worrying about exams is normal and human.
A survey of more than 2000 college undergraduate students heading into their final year exams was conducted to find out what causes and triggers their exam stress. The survey also discovered practical solutions that the students said they used to overcome their stress and anxiety. The How to Deal With Exam Anxiety Infographic reveals the findings of the independent survey, provides some practical tips to cope with exam stress and shows what triggers students’ exam fears.
View also:
The Impact of Stress on Test Scores Infographic
The Stressed Out Students Infographic
Via: www.stopprocrastinatingapp.comThe post How to Deal With Exam Anxiety Infographic appeared first on e-Learning Infographics.
eLearning Infographics
.
Blog
.
<span class='date ' tip=''><i class='icon-time'></i> Jul 15, 2015 03:33pm</span>
|
|
The Guide to Competency Based Education Infographic
Want to learn how to reduce the cost of your college degree? The Guide to Competency Based Education Infographic serves as a visual guide to everything you need to know about competency based education (CBE).
The infographic shows the evolution of alternative credit pathways throughout the history of higher ed, highlights the dramatic difference in costs between degree program types, and shows why competency based education is rapidly becoming the solution of choice for adult learners who want to get credit for life experience.
Read also:
The Rise of Competency-Based Education
View also:
How Competency-Based Education is Changing Mainstream Learning Infographic
Via: www.straighterline.comThe post The Guide to Competency Based Education Infographic appeared first on e-Learning Infographics.
eLearning Infographics
.
Blog
.
<span class='date ' tip=''><i class='icon-time'></i> Jul 15, 2015 03:31pm</span>
|
|
Boosting Knowledge Retention in eLearning Infographic
If you are an instructional designer, have you wondered how you can create sticky courses? How can you create courses that learners will remember easily and recall effortlessly long after they are back at their workplaces? It is challenging because forgetting is natural. The Boosting Knowledge Retention in eLearning Infographic shows how you can create courses that are easy to remember and difficult to forget.
1. When possible, use diagrams.
Using graphic organizers (charts, graphs, diagrams, semantic maps etc.) to create meaning is a tried-and-tested learning strategy that has been proven to aid comprehension, retention, and recall in learners.
2. Incorporate unique and out-of-the-ordinary images.
Keep the element of surprise alive, so your learners are always on the edge of their seats, eagerly trying to anticipate what you are going to serve next. Here are some other ways to break patterns to boost knowledge retention:
Use infographics.
Use different layouts to arrange and present textual content.
Use unconventional (read: weird) images or symbols to represent common ideas and associations.
Use audio or video content when images are too common.
Incorporate emphasis and contrast with color or paragraph size for important course elements.
3. Dish out sensory details.
The more the details in your content, the easier it is for the learners to create associations and remember better. The most powerful stories are descriptive pieces that paint vivid pictures with words to take us on journeys and stir intense passions in us. Visuals—photographs, illustrations, and videos—help you add details to stark facts and data. Words suffice as well. Use adjectives wisely, verbs to describe action, analogies, and comparisons to create memorable associations.
4. Use color theory.
Using colors to present content fires up the brain and stimulates intelligence across all levels, which in turn, forges more and stronger connections and aids memory formation and learning. Color can also be used to organize information more coherently. Colors also grab eyeballs readily and keep us hooked for longer lengths of time. Colors also help people remember because they affect our moods and evoke emotions. Warm tones like red, yellow, and orange excite the brain and make content memorable.
5. Exaggerate.
We remember outlandish stories. Exaggerated outcomes, images, exaggerated physical and emotional characteristics, and understatements are some effective ways to infuse life in dull eLearning content and keep the audience hooked to the course.
6. Small bites, at one’s own pace.
An effective way to create short, succinct courses is to chunk content smartly. Chunking content means to break down and organize it into bite-sized chunks that are easily digestible. When you compress data and arrange it to create logical associations, it is easy for learners to process the information without burdening the long-term memory. Chunking is also an effective way to shorten your course by doing away with all the fluff and only retaining information that is critical to the learning process. This, in turn, leaves you with less content to cram into a single session!
7. Spaced repetition.
New skills can be learned by repeating the actions needed to perform a task. We learn a new language only if we speak it often. Practice, indeed, makes a man perfect.
Read also: 7 Tips For eLearning Professionals To Enhance Knowledge Retention
Via: info.shiftelearning.comThe post Boosting Knowledge Retention in eLearning Infographic appeared first on e-Learning Infographics.
eLearning Infographics
.
Blog
.
<span class='date ' tip=''><i class='icon-time'></i> Jul 15, 2015 03:29pm</span>
|
|
Tips on Accelerating a Digital Curriculum in Your School Infographic
Adding technology to K-12 environments does not automatically improve learning. What matters most is how teachers and students use technology to develop knowledge and skills to support curricular goals and assessment practices. A digital curriculum is much more than a textbook delivered electronically. Rather than replacing your current textbook or teaching plans with an online version, consider how a digital curriculum can help you reach your school’s strategic goals. The Tips on Accelerating a Digital Curriculum in Your School Infographic presents a few best practices from innovative K-12 school systems that have successfully implemented their online programs.
1. Set Goals for Your Digital Curriculum.
A digital curriculum is much more than a textbook delivered electronically. Rather than replacing your current textbook or teaching plans with an online version, consider how a digital curriculum can help you reach your school’s strategic goals
2. Bridge the "Digital Divide" with Planning.
Your school must have the necessary infrastructure and technology to deliver its digital curriculum. This includes adequate bandwidth, wireless broadcasting and necessary student and teacher personal technology. Alternative locations should be identified where students can access and complete their online homework assignments after 2 school hours.
3. Use Digital Content to Shift Students to Active Learning.
Digital technologies give students unprecedented control over the content they consume and where and what pace they consume it. A digital curriculum can allow students to critically analyze, create, publish, and innovate—to take control their own learning!
4. Make Your Digital Content Easy for Teachers to Use & Share.
Pay special attention to:
Tagging lessons for easy access.
Incorporating components of UDL.
Procedures for copyright.
Labeling standards.
Keeping materials up-to-date.
Reviewing for quality.
5. Use Your Digital Curriculum to Make Time for the Activities You Value.
Use your digital curriculum to infuse your classroom with attributes that can improve student learning:
eLearning materials can provide personalized, frequent feedback.
Prepare your students for the future with digital literacy skills.
Incorporate STEM-focused or Project Based Learning using digital content.
Consider new instructional components and ongoing assessment to compliment your online activities.
Read also: How educators can make the transition from a print-based curriculum to a digital
Via: softchalk.comThe post Tips on Accelerating a Digital Curriculum in Your School Infographic appeared first on e-Learning Infographics.
eLearning Infographics
.
Blog
.
<span class='date ' tip=''><i class='icon-time'></i> Jul 15, 2015 03:29pm</span>
|
|
21st Century Learning Starts With IT Planning Infographic
By now, 21st-century skills such as communication, creativity, and collaboration are on everyone’s radar. Your school may even have an ambitious plan for instilling 21st-century skills in your students. But the reality is these plans don’t get too far if your computers don’t work and you can’t access the sites and services you need. The Why 21st Century Learning Starts With IT Planning Infographic, created by HP and Intel, explores the crucial steps all IT departments need to take in order to truly become a 21st-century school.
The Path to 21st Century Learning Starts With IT Planning
If you want your school to become a true 21st-century environment, the first step is IT planning in these four main categories:
The Cloud
Mobility
Big Data
Security
The Cloud
Cloud storage can be a great asset for schools … if it’s used in the right way.
95% of school districts rely on cloud services.
More than 40% of schools use cloud applications to store their data.
Only 25% of districts inform parents on the use of cloud services.
20% of districts lack policies governing the use of online services.
The largest use of cloud-based solutions in education—65 percent—is online productivity tools.
3 Steps to Take
Communicate about cloud services to all stakeholders, including students, parents and staff.
Create a policy that governs the use of cloud services and outlines steps taken to protect privacy.
Be sure your contract with your cloud service provider restricts the use or sale of student data by the vendor.
Mobility
Today’s students need to be able to learn anytime, anywhere.
27% percent of tech directors are looking to implement BYOD in the next three years.
34% of school districts have implemented tablets.
Mobile computing devices in K-12 have risen by 18.3%.
31 percent of districts have implemented a 1:1 program.
3 Steps to Take
Accommodate access to school and district networks from multiple student-owned devices to enable BYOD.
Plan to meet increasing demands for bandwidth, speed and reliability.
Provide information to parents and external groups to help support student mobility outside of school.
Big Data
We’re collecting more information than ever on our students, and we need to analyze it nimbly to help guide teaching and improve learning outcomes.
Educational data systems have become an $8 billion industry since the implementation of the Common Core State Standards in American schools.
70-85% of the effort in data analytics is devoted to data cleaning, formatting and alignment.
7% of district contracts with cloud services restrict the sale or marketing of student information by vendors.
4 Steps to Take
Provide data analytics tools and training so teachers can pinpoint what needs reteaching and predict which students will need additional help and support.
Develop a culture of using data for making instructional decisions.
Aggregate and report data to legislators, stakeholders and parents.
Expand storage and retrieval capabilities and link disparate data sets to develop both short- and long-term plans for improving education with increased personalization.
Security
We need to protect students’ and teachers’ information and keep them safe.
57% of K-12 IT leaders see student data privacy and security as more important in 2015 than it was last year.
In 2014, more than 100 bills addressing student privacy were introduced in 35 state legislatures.
63% of school districts have created clear policies about who has access to and control over the use of students’ personal data.
37% of districts have clear and explicit policies to support notification of affected individuals when there is a substantial risk of harm from a data breach.
3 Steps to Take
Protect student data and the district network from cyber attacks.
Secure collaboration across departments; sensitive student information should not be sent in email attachments.
Require vendors who work with the district to ensure proper privacy and security standards; consider physical as well as digital security.
Via: www.weareteachers.comThe post 21st Century Learning Starts With IT Planning Infographic appeared first on e-Learning Infographics.
eLearning Infographics
.
Blog
.
<span class='date ' tip=''><i class='icon-time'></i> Jul 15, 2015 03:29pm</span>
|
|
How Technology Transforms Learning and Teaching Infographic
How Technology Transforms Learning and Teaching Infographic shows how ed tech is revolutionizing learning and instruction!
Technology transforms learning
More than 50% of students in grades 6-12 go online for homework help at least once a week
41% of students would like to take a virtual class to learn at their own pace
Students who study on mobile devices study 40 minutes more per week than those who don’t
Students in blended reading classrooms exceed growth expectations by 50%
Today’s students use mobile devices for:
- Anytime research 60%
- Educational games 43%
- Collaboration with peers 40%
- School-related alerts 33%
Technology transforms teaching
91% of administrators say effective use of edtech is critical to their mission of high student achievement
6 in 10 school principals have implemented some form of blended learning
89% of teachers agree technology improves student outcomes
73% say technology allows them to respond to a variety of learning styles
87% say it helps students collaborate - a key requirement of the Common Core
Let ISTE 2015 transform you.
Thousands of educators gain critical digital age skills at the ISTE Conference & Expo. Groundbreaking ideas are shared, new learning technologies are unveiled and seeds are planted that will impact education for years to come. Take your place among the trailblazers who are revolutionizing learning at ISTE 2015. Learn innovative strategies for:
1:1/BYOD implementation
Professional learning
iPad
Flipped classrooms
Google Apps and more.
Via: www.isteconference.orgThe post How Technology Transforms Learning and Teaching Infographic appeared first on e-Learning Infographics.
eLearning Infographics
.
Blog
.
<span class='date ' tip=''><i class='icon-time'></i> Jul 15, 2015 03:29pm</span>
|
|
Coursmos Micro-learning Platform with 30000 Micro-courses Infographic
The Coursmos Micro-learning Platform with 30000 Micro-courses Infographic presents how Coursmos is leading the way in defining what micro learning means and developing it to achieve its maximum potential. Coursmos is not another web app with a firehose of information to knock you off your feet, but a smooth flow of learning, on tap, personal, contextual and most of all adapted to your life and schedule.
Coursmos announced that it has gathered over 30,000 micro-courses taught by over 800,000 learners from around the world. Micro-courses allow you to study fast and efficient by providing only the most important information for you. Coursmos also offers over 127,500 micro-lessons on such topics like business, startups, higher education, technology and health.
All micro-courses on the platform are divided into categories for easy and quick browsing. Each lesson also has a complete intention, which is an idea that could be understood within a few minutes and then successfully implemented into daily activity. From Big Data core knowledge or tips on how to improve your sleep, Coursmos offers a wide range of educational opportunities!
According to Coursmos data, leading participating countries include the United States, Russia, India with 51,5%, 14,72%, and 2,87% of learners, respectively. The number of registered learners has greatly increased since the beginning of the year by 33%. Of these 800,000 students, average learners are between 25 and 34 years old and are predominantly male. 42.5% of Coursmos learners prefer to study mobile.
Via: coursmos.comThe post Coursmos Micro-learning Platform with 30000 Micro-courses Infographic appeared first on e-Learning Infographics.
eLearning Infographics
.
Blog
.
<span class='date ' tip=''><i class='icon-time'></i> Jul 15, 2015 03:28pm</span>
|
|
The Growth of Technology Expenses in Education Infographic
With technology growing so rapidly, it’s not surprising to see that the technology spending in American school districts is growing just as fast. The Growth of Technology Expenses in Education Infographic presents how funds are being used in schools and which types of schools are adopting technology most rapidly. Technology expenses are projected to only increase in the future, and you might be surprised at some of the uses of technology in the classroom. Not only is technology aiding students in their learning, but it also streamlining the ways teachers and education faculty work together, making communication faster and easier.
Biggest Expenses
Real spending per pupil ranges from a low of $12,000 in the Phoenix area schools to a high of nearly $27,000 in the New York metro area.
Education leaders say they want to focus resources on the core subjects of math, reading, history, and science, but per-pupil spending tends to be much higher for electives, extracurricular activities, and sports.
Chicago Public Schools report spending about $40 million a year on technology.
This year, $34 million was invested in big data for K12, up from just $5 million last year. The influx of new technical talent into education, crossing over from other industries, is promising to build the quality of tools needed in K12.
Schools in the U. S. spend a lot of money on education technology—estimated soon to be $56 billion dollars—36% of which is spent in K-12 education. That’s about $400 per student per year.
Public schools are spending 93% more than the estimated median private school.
Growth of Technology
One Illinois School District provides about 2,000 computer workstations for 3,100 students, and students can login to district computers from home to continue work they started at school.
Students are taking notes on iPads and developing ideas for a game they would create over the course of the semester in teams.
Over the 10 year span from 1995 to 2005, the percentage of schools with Internet access rose from 8% to 97%
23% of all public school teachers have an interactive whiteboard in their classroom and 4% have a handheld device.
A survey conducted by the U.S. Department of Education
In 2009, Internet access was available for 93% of the computers located in the classroom every day.
The ratio of students to computers in the classroom every day was 5.3 to 1.
Teachers reported that they or their students used computers in the classroom during instructional time often (40%).
Teachers reported that they or their students used computers in other locations in the school during instructional time often (29%).
In 2013, 68% of students stated that their teacher uses technology effectively.
90% of teachers had either a laptop or PC in the classroom.
71% of teachers said that apps are beneficial for teaching.
64% of teachers used tablets for educational websites.
60% made use of educational e-books/textbooks.
The Education Cloud
Cloud storage saves space, money, and time for teachers, parents, students and administrators. Through the cloud, students are able to talk, view, and interact with presentation and media content, record notes, and access the web, all at the same time, from anywhere.
A report by CDW Government found that over 40% of schools use cloud applications to store their data and by 2016, schools are expected to spend 35% of IT budgets on the cloud. Through K-12 cloud platforms like Edline, teachers have better communication with parents and students regarding assignments, tests, and projects. Parents can login from anywhere (including their phones or tablets) and instantly know how their kids are progressing.
Right now, K-12 schools report that their cloud initiatives are saving them an average of 20% on IT costs. By 2016, those savings are expected to reach 27%.
Via: skycentral.comThe post The Growth of Technology Expenses in Education Infographic appeared first on e-Learning Infographics.
eLearning Infographics
.
Blog
.
<span class='date ' tip=''><i class='icon-time'></i> Jul 15, 2015 03:28pm</span>
|