


Blogs
|
Teacher’s Appreciation Day Around The World Infographic
Teacher’s day is celebrated to appreciate the teachers efforts. The idea of celebrating Teacher’s day arose independently in many countries during the 20th century. In most cases, a local educator or an important milestone in education was celebrated which is the main reason for countries not having a common Teacher’s Day throughout the world. Teacher’s Day is celebrated all over the world although the date and manner of celebration varies from country to country. The Teacher’s Appreciation Day Around The World Infographic depicts on dates of teacher’s day celebration all over the world.
National Teacher Day Around The World
January
15 Venezuela
16 Thailand
29 Spain
30 Greece
February
First Weekend of February: Mongolia
28 Algeria, Jordan, Libya, Morocco, Oman, Saudi Arabia, Tunisia, U.A.E., Yemen
March
7 Albania
9 Lebanon
18 Syria
28 Slovakia, Czech Republic
23 Kislev (3rd month of the Year): Israel
April
13 Ecuador
30 Paraguay
May
2 Bhutan, Iran
6 Jamaica
15 Colombia, Mexico, South Korea
16 Malaysia
Whole 1st week of May observed as teacher’s Appreciated Week and last day is celebrated as Teacher’s Day: United States
June
6 Bolivia
22 El Salvador
25 Guatemala
First Sunday of June: Hungary
July
6 Peru
September
5 India
10 Hong Kong, China
11 Argentina
17 Honduras
23 Brunei Darussalam
28 Taiwan
October
1 Uzbekistan
4 Bangladesh
5 Azerbaijan, Bulgaria, Cameroon, Canada, Estonia, Germany, Kuwait, Lithuania, Macedonia, Mauritius, Maldives, Republic of Moldova, Netherlands, Philippines, Pakistan, Qatar, Romania, Russia, Serbia, United Kingdom
7 Laos
14 Poland
15 Brazil
16 Chile
Last Friday: Australia
First Sunday: Belarus, Armenia, Ukraine
November
20 Vitnam
24 Turkey
25 Indonesia
December
Last Friday: Panama
Via: graphs.netThe post Teacher’s Appreciation Day Around The World Infographic appeared first on e-Learning Infographics.
eLearning Infographics
.
Blog
.
<span class='date ' tip=''><i class='icon-time'></i> Jul 15, 2015 03:27pm</span>
|
|
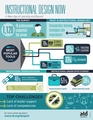
Instructional Design Now Infographic
Instructional Design Now Infographic, a collaboration of the Association for Talent Development (ATD) and the Institute for Corporate Productivity (i4cp), explores a learning landscape rich in emerging opportunities, populated by professionals eager to create and unleash content that drives employee development and organizational performance.
A century ago, education systems and instructional design (ID) were shaped by the concepts of scientific investigation and empirical knowledge. Fifty years later, instructional systems, as well as their components and properties, were revealed in the writings of Robert Gagne, James Finn, and others (McNeil 2014). Today, instructional design is at the core of an organizational learning industry that finds itself inundated with new tools, technologies, and approaches.
Instructional design appears to be retaining many traditional touches, despite the constant challenges from evolving technologies, corporate expansions taking employees’ learning needs global, and perennial struggles for funding and support. Live, instructor-led classrooms are still widely used in organizations, and other personal-touch learning methods, such as face-to-face coaching and mentoring, continue to produce effective results.
But ATD and i4cp found that instructional designers don’t rate their profession’s overall efforts as highly as they might. Only about half of surveyed design and learning practitioners characterized their instructional design efforts as effective in helping to meet organizational business objectives. Far fewer believed that their instructional design was highly effective at addressing learning needs.
The diverse influences on instructional design today raise many interesting questions. Does formal education still play a valuable role in preparing designers for the challenges of the workplace? Are most organizations embracing high-tech options, such as mobile learning, social learning, and MOOCs? Which of the newer tools and approaches produce better learning results for companies? And what can instructional designers expect the next few years to bring?
With those questions in mind, ATD and i4cp gathered insights from instructional designers and learning professionals worldwide to assess the current and anticipated future states of ID and its contributions to business success. Find out more in the Instructional Design Now: A New Age of Learning and Beyond report.
Via: www.td.orgThe post Instructional Design Now Infographic appeared first on e-Learning Infographics.
eLearning Infographics
.
Blog
.
<span class='date ' tip=''><i class='icon-time'></i> Jul 15, 2015 03:26pm</span>
|
|
How to Use PowerPoint Effectively Infographic
The How to Use PowerPoint Effectively Infographic presents a three step process towards an effective presentation using PowerPoint.
1. Planning
Whatever you do, don’t rush into it. Begin by concentrating on your story. What are you trying to tell? How can I condense my story so I can efficiently communicate it with my audience? Break down the key points of the story, then break it down even more into simple terms.
2. Design
Learn from the experts. The following three thought leaders have a unique presentation style.
Steve Jobs - Minimalism
No distracting backgrounds.
Use short, memorable text.
No bullet points or lists (ironic!).
Guy Kawasaki - 10.20.30 Rule
No more than 10 slides.
No longer than 20 minutes.
Nothing smaller than 30-point text.
Steve Godin - Imagery
Use striking, bold imagery.
No animated transitions or sound effects.
Tell your story.
3. Execution
Now it’s time to perform! A good PowerPoint design provokes emotion and engages the audience.
Here’s a few tips on presenting well:
Understand the technical stuff.
Don’t be motionless.
Make it about the audience, not you.
Believe in your material.
Tell your story in simple terms.
Don’t read from your slides.
Via: cubicleninjas.comThe post How to Use PowerPoint Effectively Infographic appeared first on e-Learning Infographics.
eLearning Infographics
.
Blog
.
<span class='date ' tip=''><i class='icon-time'></i> Jul 15, 2015 03:25pm</span>
|
|
Chief Learning Officers Infographic
Chief Learning Officers Infographic presents everything you need to know about Chief Learning Officers by explaining that the CLO title carries with it an expanded skill set, leadership role, and scope of responsibilities in today’s predominant eLearning environment.
What is a Chief Learning Officer (CLO)?
A position best suited to a team player with an eye toward collaboration and someone who fully embraces eLearning in all its formats. The CLO’s primary leadership role is to formulate the strategy to drive corporate learning direction, goals and policies. Together with the Chief Information Officer (CIO) and the Chief Technology Officer (CTO), the CLO disseminates knowledge and information to the learner through technology, social media, and occasionally, through human resources (instructors). And, as always, it’s the person in top C-level leadership position who is responsible for bringing it all in at or under budget.
The first CLO ever (on record) is Steve Kerr, who was hired in 1990 by Jack Welch to oversee GE’s learning and development.
Notable Modern CLOs
Tom Evans, PwC. 2014 CLO of the year. In charge of development for 39,000 employees.
Amy Hayes, Facebook. Global head of Learning & Development for 9500 employees.
Tamar Elkeles, Qualcomm. 2010 CLO of the year. In charge of learning for 23,000 employees.
CLO Gender Breakdown
Women Represent 45% of CLOs are female and 55% male.
CLO Average Salary
San Francisco, CA $140,000
Greater NYC Area $139,000
Los Angeles, CA $133,000
Boston, MA $125,000
Washington, DC $123,000
Houston, TX $122,000
Seattle, WA $121,000
Dallas, TX $120,000
Chicago, IL $116,000
Atlanta, GA $110,000
Where Do CLO’s Work?
Greater NYC Area 10.00%
San Francisco Bay Area 5.50%
Greater Chicago Area 5.00%
Greater Atlanta Area 4.00%
Greater Boston Area 4.00%
Dallas/Fort Worth Area 3.50%
Greater Philadelphia 3%
Greater Los Angeles 2.50%
Greater Denver Area 2.50%
Baltimore Area 2%
Greater Seattle Area 1.50%
Greater Minneapolis 1.50%
Raleigh-Durham 1.50%
Phoenix Area 1.50%
Greater St. Louis Area 1.50%
Greater Detroit Area 1%
Orlando Area 1%
Greater San Diego Area 1%
Tampa/St. Petersburg 1%
Cleveland/Akron 1%
Charlotte Area 0.50%
Greater Austin Area 0.50%
Richmond Area 0.50%
Sacramento 0.50%
Cincinnati 0.50%
Portland 0.50%
Indianapolis 0.50%
Jacksonville 0.50%
Orange County 0.50%
Greater Milwaukee Area 0.50%
What Industries Do CLOs Work In?
Education Management 12%
Professional Training 11.50%
Human Resources 10%
Management Consulting 9.50%
Hospital/Healthcare/Pharma 8.50%
eLearning Industry 6.50%
Government Administration 5.50%
Higher Education 4%
Financial Services & Banking 3.50%
Non-Profit Sector 3%
Information Technology 2.50%
Defense & Space 1%
Other 22%
How Many Years of Professional Experience Do CLOs Have?
It’s no surprise here that over 90% of CLOs have a minimum of 10 years of corporate experience. In fact, we would have expected that number to be higher than 92%, since this a position which draws on a lot of corporate experience. Regardless, the average total of experience was approximately 18 years, which is more in line with what we expected.
Fortune 50 Companies and CLOs
It seems clear that nearly every Fortune 50 company has a chief learning officer - even if that’s not the current title being used. The question is, what are their job titles, exactly? Many CLO’s exist in the form of a training director, head of L&D, or even a CEO. But more and more, the official job title of chief learning officer is becoming mainstream.
Some of the Fortune 50 companies that employ official CLOs are: Citigroup, Bank of America, HP, Goldman Sachs, JP Morgan, GE, Hess, and Caterpillar. When we expand the list to Fortune 500, there are a few more notable companies, among others: Cisco, New York Life Insurance, American Express, CHS, Nike, AIG, McDonalds, Merck, General Mills, and Master Card.
Relevant Industry Statistics
In 2014 alone, $70 billion was spent on corporate training. And in 2015, eLearning is expected to reach $107 billion, representing a +9.5% growth since the previous year. In regard to general learning and development, over $160 billion is spent per year, and increasing each year.
What Does a CLO Do?
A chief learning officer’s job is comprised of 2 spectrums: overall job responsibilities as well as day-to-day tasks.
Responsibilities:
Develops an organization’s educational process
Promotes knowledge management
Institutes effective training strategies
Directs large scale change management (if applicable)
Oversees and institutes latest technology
Promotes importance of learning & ROI to shareholders
Day to Day Job Tasks:
Reviews all training modules
Ensures that learning sessions are engaging & memorable
Communicate daily with managers on employee progress
Communicate daily with C-suite to maintain symmetry
Review macro-level HR processes
Assists with learning & development for in-house processes
Core Learning Principles Used by CLO’s
Instructional Design
Mobile learning
Micro learning
Social learning
Blended learning
Gamification
Learning Management Systems
Read also:
How The Chief Learning Officer (CLO) Got It’s Name
Via: elearningmind.comThe post Chief Learning Officers Infographic appeared first on e-Learning Infographics.
eLearning Infographics
.
Blog
.
<span class='date ' tip=''><i class='icon-time'></i> Jul 15, 2015 03:24pm</span>
|
|
Blended Learning 2015: What Does It Look Like? Infographic
Blended learning has grown increasingly popular in the corporate training arena in recent years. With so much technology now available to us, blended learning models can include a number of different methods of learning.
The Blended Learning 2015: What does it look like? Infographic was designed by Interactive Services based on the results of research carried out in 2014. The infographic highlights survey-driven data obtained from senior learning professionals across multiple industries about their views on the topic of blended learning and what they believe the future of learning looks like.
Measure of Success
With an annual training spend of over $140 billion in North America alone, why is so little data available on Return on Investment (RoI) on training? Organizations that measure the impact of their training dollars are few and far between. Is this due to lack of resources, or the unwillingness of a business to acknowledge the inefficacy of its current training model? Who cares if training fails? And what is the opportunity for L&D if we can prove that it works?
What did our research tell us?
Only 28% of organizations measure training against business KPIs.
Learner-driven evaluation is the most utilized form of training evaluation.
Only 20% of organizations invite external evaluation of training.
Control groups are utilized by only 20% of organizations.
What methods does your organization use to measure training effectiveness?
Happy sheets
Online surveys
Control groups
KPI link
Structured interviews
Management feedback
Compliants
Coaching
Supervisor assessment
External audit/analysis
What you said…
The metric leadership wants is RoI, but we measure money saved, not impact on the P&L.
We are good at designing training, but not so hot at proving its effectiveness.
Internal teams are shrinking. If I have to choose, I’d rather have a developer than an analyst on my team.
Mobile
Most organizations we spoke to deployed some kind of mobile learning project in 2014. The majority of these projects were tablet based, with only a few use cases involving mobile phones. While e-learning made up the majority of these projects, other formats like video, audio, and workbooks saw a revival. Being able to access these materials while offline was seen as a big plus. Infrastructure and device compatibility were the main hurdles to deployment. So how do we make the most of mobile?
What the data said…
Clients felt that tablet-based learning (75%) was a good use of budget. Only (48%) said the same about phone-based learning. Infrastructure and technology was the biggest hurdle to deploying tablet-based learning (45%). However, evidence of impact was listed (30%) as the main hurdle to deploying phone-based learning.
What you said…
Right now, mobile is only for flagship projects.
If you want to get mobile accepted, get a program developed for the exec audience and let it trickle down from there.
We saved a million dollars in printing costs this year by moving two workbook programs to tablet delivery.
Video
Video is recognized as an increasingly important training method. However, the way video is produced and digested is changing. The rise of YouTube, Instagram, and Vine has legitimized the development and inclusion of user-generated video and ‘low-cost’ video. Additionally, the increase in mobile and tablet-based learning appears to be linked to an increase in the use of video.
What the data said…
90% of clients consider video to be good value for money.
25% of clients said the biggest hurdle to introducing more video is cost.
Video is perceived by 50% of L&D to perform well and 30% say it’s currently underutilized.
What you said…
Traditional broadcast quality is perceived as ‘too slick’ for our users these days.
The financial and expertize barrier to entry is disappearing for video kit.
We still have infrastructure issues. Our video is not reaching as far as we would like.
Gamification
Gamification can be broadly separated into two broad areas:
Traditional learning programs where gamification elements were used to make the experience more engaging.
Programs designed to simulate and practice a task, sometimes repetitively.
What you said…
The exec. population is skeptical - they think gamification trivializes the subject.
It costs too much and takes too long. I need quicker results.
It’s hard to visualize the end result for the client during the early stage design; they usually default to something less challenging.
MOOCs
MOOCs are still considered experimental in their organizations. MOOCs offer great potential, but the right model for implementation and management has not yet been developed. Issues of scope definition and resource ownership mean that long-term curation and management of the MOOC is contentious.
What the data said…
Only 25% of respondents have attempted to implement a MOOC while almost 40% of respondents said their organization has no appetite to look at MOOCs in 2015.
Evidence of impact is seen as the top barrier to implementation (33%).
65% of clients feel MOOCs are a poor use of budget in 2015.
What you said…
MOOCs appealed to us because we were going with a ‘no money, no people strategy’ due to the crisis, but it turned out to be more work than we anticipated.
For CPD it worked well. It’s great for structuring a repository.
If the quality dips then people turn off quite quickly.
For more information read the Blended Learning 2015 - Future of Learning Whitepaper by Interactive Services.
Via: interactiveservices.comThe post Blended Learning 2015: What Does It Look Like? Infographic appeared first on e-Learning Infographics.
eLearning Infographics
.
Blog
.
<span class='date ' tip=''><i class='icon-time'></i> Jul 15, 2015 03:24pm</span>
|
|
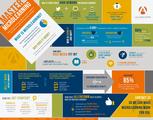
How to Master Microlearning Infographic
The Fortune 500 and other cutting-edge companies are using microlearning to change the way they approach training and development. By focusing on short, relevant, engaging content, they are simultaneously gaining more employee buy-in and better overall results. The How to Master Microlearning Infographic shows how you can make your training programs more engaging and effective with this learning strategy.
What is microlearning?
Microlearning involves the process of reorganizing your training program into several short courses.
Why does it work?
This approach allows your employees to learn a job-specific concept and apply it immediately.
Why is there such a high demand for microlearning?
Advances in technology. (Twitter, YouTube, Vine, etc.)
It’s essential to get employees up to speed quickly. A need for shorter, more relevant training methods.
When compared to traditional training this method saves time and saves cost.
Who is using it and why?
Companies with 5,000+ employees and/or a global workforce.
Employees love it. They learn something they can use now and… they feel more in control of their training.
Corporations love it. Engages and reinforces for greater sustainment.
How does rich media fit in?
It reflects the way people get information today.
It tells a story.
It can convey a lot a lot of info in a short amount of time.
Visuals are processed 60,000x faster in the brain than text.
It streams anywhere. (computers, phones, tablets, etc.)
Will it work for my company?
Do you have salespeople or resellers who need product & sales training?
Get them confident and customer-ready fast!
Do you have employees whose performance would improve with short training segments?
Give them frequent opportunities to refresh their skills!
How do I get started?
Prioritize. Bring the most task relevant content to the forefront.
Have a curriculum road map and ensure your microlearning is part of it.
Determine how to incorporate rich media and other engaging learning elements.
Read also:
4 Steps to Microlearning Mastery
Microlearning Pros and Cons
Why Microlearning is HUGE and how to be a part of it
Via: www.allencomm.comThe post How to Master Microlearning Infographic appeared first on e-Learning Infographics.
eLearning Infographics
.
Blog
.
<span class='date ' tip=''><i class='icon-time'></i> Jul 15, 2015 03:24pm</span>
|
|
8 Work-Life Balance Tips for Busy Mums Infographic
Do you feel like you are spending too much time working and not enough with your family? You are not alone! Many mums are struggling to keep the right balance between their work life and the needs of their families. Retaining work-life balance is challenging, especially if you are a working mom! Juggling with work demands and childrearing duties can seriously affect your personal and professional life. Technology makes us accessible everywhere and fear of job loss justifies the longer working hours. Stress can hurt relationships, your health and happiness. This is the reason you may be feeling a day’s 24 hours are not even close to being enough to get things done and prepare for the next day! Fortunately though, it is not impossible to manage both career and family!
Although work and life balance mean something else for each of us, in order to stay on top of your game as a full-time employee and also a mother, you will need to make small sacrifices that will ultimately help you be more effective! The 8 Work-Life Balance Tips for Busy Mums Infographic offers some very useful tips in regards to establishing a work-life balance as a busy mom that are worth checking out! As this infographic shows, improving your time management skills and planning ahead are key elements to achieving work-life balance!
Via: www.serenataflowers.comThe post 8 Work-Life Balance Tips for Busy Mums Infographic appeared first on e-Learning Infographics.
eLearning Infographics
.
Blog
.
<span class='date ' tip=''><i class='icon-time'></i> Jul 15, 2015 03:21pm</span>
|
|
The Evolution of the Modern Day Classroom Infographic
There was a time in the not-too-distant past when young adults completed high school, moved swiftly into a job or trade apprenticeship, started a family, or - entered a four-year traditional university to work toward their college degree. Enter the modern age, where higher education has received a much needed facelift. The Evolution of the Modern Day Classroom Infographic explores the benefits of the modern day classroom and presents interestings facts and stats!
The Modern Day Classroom by the Numbers
There are currently 2.6 million students pursuing an online degree. Of these millions of learners, 56% are employed full-time, and 16% are employed part-time. These nontraditional students take their education seriously, enjoy lower education-related debts than traditional students, and can continue to advance their careers - all thanks to the modern evolution of higher education. In addition to online learning options, some of the most advanced schools, like Brandman University, offer blended programs that combine face-to-face instruction with virtual learning to accommodate to the schedules of busy adult students.
For more information dowload the Modern Day Classroom e-book and discover how you can receive the credibility and in-person learning opportunities of a traditional classroom, while benefiting from the flexibility of an online degree program. Most importantly, learn how you can earn your degree and advance your career without putting your life on hold.
Via: www.brandman.eduThe post The Evolution of the Modern Day Classroom Infographic appeared first on e-Learning Infographics.
eLearning Infographics
.
Blog
.
<span class='date ' tip=''><i class='icon-time'></i> Jul 15, 2015 03:19pm</span>
|
|
Best Mobile Apps for Sensory Impairment Infographic
This Best Mobile Apps for Sensory Impairment Infographic highlights the best mobile apps for both the visually impaired and the hard of hearing.
What is sensory impairment?
Sensory impairment or disability, is when one of your senses; sight, hearing, smell, touch or taste, is no longer functioning normally. A person does not have full loss of a sense to be sensory impaired. 95% of the information about the world around us comes from our vision and our hearing.
Vision Impairment vs. Hearing Impairment
285 million people are estimated to be visually impaired worldwide.
39 million people are completely blind.
More than 4 in 5 people living with blindness are aged 50+.
360 million people have moderate to profound hearing loss.
Current production of hearing aids meets less than 10% of global need.
Approximately 1 in 3 people aged 65+ are affected by disabling hearing loss.
Mobile Apps for Vision Impairment
The apps listed are reviewed in detail as to how someone with a visual impairment can use them, by purpose and features.
Tap Tap See App
What it does: Uses the device’s camera and VoiceOver functions to photograph objects and identify them out loud for the user.
Features:
Double tapping the screen enables the user to photograph any 2D or 3D object at any angle and define the object within seconds.
The device’s VoiceOver function audibly identifies the object to the user.
Includes the ability to repeat the last image’s identification and save the image to the camera roll with the attached tag.
Allows the upload of identified images from the camera roll and can share identification via twitter, facebook, text or email.
Platforms: iOS and Android
Cost: New users are provided with 100 trial pictures to start. 4 subscription plans are available starting from $4.99+.
Be My Eyes App
What it does: It connects blind people with volunteer helpers globally via live video chat. A blind person requests assistance via the app. The volunteer receives a notification for help and a live video connection is established.
Features:
Utilises the iPhone VoiceOver technology which enables synthetic speech and a touch based interface.
At the end of each session there is a ‘rate it’ or ‘report misuse’ option both for the helper and the user.
Platforms: iOS. Android version in production.
Cost: Free, but a subscription may be put in place from September 2015.
Color ID App
What it does: The camera on on iPhone or iPod touch speaks the names of colours in real time.
Features:
Augmented Reality technology app to discover the names of colours around you.
A toggle button at the top left corner enables the user to move from simple colours to exotic colours.
Platforms: iOS
Cost: Free.
Best of the Rest
Ariadne GPS
Voice Brief
Talking Calculator
Mobile Apps for Hearing Impairment
The apps listed are reviewed in detail as to how someone with a hearing impairment can use them, by purpose and features.
ASL Dictionary App
What it does: Video instruction of over 5,000+ words signed by a professional ASL (American Sign Language) interpreter. It offers deaf and hard of hearing people a portable and convenient way of learning and using sign language in their daily lives.
Features:
A searchable dictionary divided into 7 categories each with its own list of alphabetical entries.
An Onscreen keyboard allows users to search words and numbers.
A video comes with each video demonstrating a word, phrase, number, or symbol.
Teaches users how to translate common English phrases into ASL.
Includes 765 multiple meaning words, 473 idioms and the ASL numerical system to represent money, time, date and years.
Platforms: iOS, Android, Amazon Kindle, B&N Nook and Windows Mobile.
Cost: Ranging from $4.99 to $7.99, platform dependent.
Tap Tap App
What it does: Helps deaf and hearing impaired people respond to their audio environment.
Features:
When it detects noise, the app will vibrate and flash to alert the user.
Adjusts sensitivity for noisier environments.
Platforms: iOS
Cost: $2.99
Netflix App
What it does: Plays unlimited movies and TV shows.
Features:
80% of the movies and TV shows it offers have closed caption subtitles for those deaf or hard of hearing.
Closed caption subtitles mean that the subtitles spell out the dialogue and the sound, for example to alert the viewer that a song is playing or a door is shutting.
Platforms: iOS, Android and Windows.
Cost: The app is free once signed up to a paid monthly subscription from $8.99. Has a 1 month free trial option.
Best of the Rest:
LouderTV
Play It Down
Dragon Dictation
Via: www.home-healthcare-adaptations.ieThe post Best Mobile Apps for Sensory Impairment Infographic appeared first on e-Learning Infographics.
eLearning Infographics
.
Blog
.
<span class='date ' tip=''><i class='icon-time'></i> Jul 15, 2015 03:19pm</span>
|
|
The ROI of Social Learning Infographic
Eighty percent of learning takes place through on-the-job interactions with peers, experts, and managers, according to Bersin and Associates. This type of informal learning, referred to as social learning, is key in driving employee development and engagement across an organization.
In fact, 86 percent of employees say they learn what they need to know for work by collaborating with others, according to River Software’s 2014 study. Yet, organizations still spend too much money on formal training — for instance, a whopping $164 billion in 2012, according to ATD.
The ROI of Social Learning Infographic explains why managers should take a step back from formal training to focus their efforts on social learning.
Are Formal Training Programs a Poor ROI?
The cost to have 1 hour of formal learning available is $1,798.
In just 1 week people FORGET 70% of what they learned in a formal training program.
In 1 month, they will have forgotten 87%.
In other words, money spent on quickly-forgotten formation is wasted, and could even result in employees leaving.
8 in 10 employees will leave an organization if they don’t receive the right training to perform their job effectively.
What Impacts Employee Development
Peer Collaboration
86% of employees said that they are learning what they need to know for work by collaborating with others.
80% said working with people they like is highly motivating. This increases to 90% for employees 36 and older.
Hands-on Learning Experiences
52% of Americans say active participation through hands-on training is the best learning merhod.
Providing hands-on learning increased students’ participation from 34.7% to 44.4%.
Feedback
Employees working under leaders who give honest feedback tanked highest in employee engagement (77the percentile) while employees working under leaders who gave minimal feedback, if any, ranked lowest in employee engagement (25th percentile)
Why Do We Learn Better Socially?
Much of what we learn at work occurs as we learn from our own experiences and what we observe of the experiences of others. (Clive Shepherd, author of The New Learning Architect)
Social learning has always taken place in the workplace but new technologies open up greater opportunities. You can ask a question to fellow colleagues… take part in an online chat or read a relevant blog post with advice from a colleague and respond. (Con Solidis, LearnKotch Consulting)
People have always learned best from one another - social media enables this to happen unrestricted by physical location and in all kinds of extraordinarily creative ways. (Marcia Conner, author of The New Social Learning: A Guide lo Transforming Organizations Through Social Media)
Social Learning Is the Solution
Here is what happens when employees have the opportunity to learn from one another socially:
Smoother onboarding: 90% of organizations believe employees make their decisions to stay within the first year.
Higher employee retention: 76% of respondents said opportunities for growth was the top reason they stay in an organization.This increases to 90% for millennials under 25.
Increased employee performance: Trainees increased their performance by 22% through deliberate reflection and sharing lessons learned with others.
Social learning doesn’t require everyone to work from the same place, but employees do need the right tools:
Visual demonstration tools: 32% of women and 25% of men say visual demonstrations help them learn best.
A feedback mechanism: 41% of non-Millenial and 29% of Millennial employees expect more feedback than they currently receive.
Social communication tools: 49% of Millennials support the use of social tools for workplace collaboration.
Content development tools: Empowering employees to train others resulted in a 15% increase in employee engagement and a 7% increase in creativity.
Tools to facilitate on-on-one mentorships: 40% of organizations have mentoring programs in place to help prevent losing knowledge-hungry Millennials to other companies
Create more social learning opportunities and soon your employees will be brimming with expertise and know-how.
Via: showd.meThe post The ROI of Social Learning Infographic appeared first on e-Learning Infographics.
eLearning Infographics
.
Blog
.
<span class='date ' tip=''><i class='icon-time'></i> Jul 15, 2015 03:19pm</span>
|