


Blogs
|
Analysis: Texas Schools, by the Numbers
by Ross Ramsey,
The Texas Tribune
July 13,...
Tim Holt
.
Blog
.
<span class='date ' tip=''><i class='icon-time'></i> Jul 15, 2015 04:35pm</span>
|
|
Rethinking Direct Instruction in Online Learning: From the article:
The final phase of Direct...
Tim Holt
.
Blog
.
<span class='date ' tip=''><i class='icon-time'></i> Jul 15, 2015 04:35pm</span>
|
|
Designing the Active Learning Classroom: This looks like a really nice resource to start an active...
Tim Holt
.
Blog
.
<span class='date ' tip=''><i class='icon-time'></i> Jul 15, 2015 04:35pm</span>
|
|
8 Ways to Engage eLearners Infographic
Do you struggle to engage your staff through e-learning? The 8 Ways to Engage eLearners Infographic provides 8 engagement tips that will leave your learners energised and primed to look at your learning in a different light.
How to Engage eLearners:
Grab their attention.
Be thought provoking, give statistics or quick snippets of real life situations that make your learner sit up and think.
Get them to think
Use οpen input questions giving the learner time to think about what they already know & what they are unsure of.
Only tell them what they need to know.
Break information down into bite size chunks to allow the learner to absorb the learning fully. Clickable text and graphics are extremely important.
Knowledge checks.
Check learner knowledge throughout the course, making sure it can be applied to realistic situations. Use Multiple Choice, Drag & Drop and give meaningful feedback.
Tell stories.
Bring your e-learning to life! Stories help learners to relate to concepts in real life situations, consolidating any new knowledge.
Use formative assessment.
Use short formative assessments to personalize learning and allow learners to check what they already know and identify gaps in knowledge.
Deliver responsive eLearning.
Using tools like will Adapt Learning allow learners to access learning on the go on mobile and tablet devices
Get the right blend.
Webinars and short quizzes can break up boring eLearning courses. Tools like Encore mobile learning can push small knowledge bites to learners reinforcing & refreshing the learning.
View also:
Engaging Students in eLearning Infographic
Engaged vs Unengaged Learners Infographic
Read also:
9 Tips To Improve Online Learners’ Engagement
Guiding Your Learner Toward Engagement
5 Tips To Drive Up Learner Engagement Online
Via: www.learningpool.comThe post 8 Ways to Engage eLearners Infographic appeared first on e-Learning Infographics.
eLearning Infographics
.
Blog
.
<span class='date ' tip=''><i class='icon-time'></i> Jul 15, 2015 04:33pm</span>
|
|
Different Writing Techniques of Famous Writers Infographic
The famous writers have made significant contributions not just to readers but also to aspiring writers. Through their works, those who also dream of becoming prolific writers can learn from the experts. All of the best writers share almost the same set of attributes, techniques and habits. One of the most common things that one can notice is that writers keep their own diary or journal. When you have your own journal, you can constantly practice since you can set your quota when it comes to the number of words that you want to write in a day and you can also express yourself without restraints. Famous writers all have their own personal time for writing and some would even have their own personal offices. Apart from taking the time to practice and to let your thoughts run freely, one common traits of the best writers is that they read a lot. Reading is one way for you to learn different techniques and widen your perspective. The Different Writing Techniques of Famous Writers Infographic presents famous writers’ techniques that can help you become a more productive and hopefully successful writer.
Keep a Journal
This is your place where you can be you and you can write whatever you want. This is the place where you try out new things, say outrageous things and just be comfortable with the physical act of writing. Madeline L’Engle, A Wrinkle in Time, said, "You need to keep an honest, unpublishable journal that nobody reads, nobody but you. Where you just put down what you think about life, what you think about things, what you think is fair and what you think is unfair."
Word Quotas
Stephen King has a quota for 2000 words a day and Arthur Conan Doyle wrote 3,000 words a day. Word quotas can help you stay motivated to keep writing. Remember the more you write, the easier the writing will become.
Write Standing or Laying
Writing got you down; do you find yourself not focusing while sitting at your computer or desk? Why not try Hemingway’s approach—he wrote all his novels while standing. Or you can be like Truman Capote, who wrote laying down. If you are used to doing one thing then changing the physicality of how you write may spark those creative juices. This could also work, if you are always too distracted by the internet, try writing in long hand like many authors did back in the past.
Make an Office
With writing, you may need to make your private office. It could be a shed with a light and desk, or you could rent space from an office—whatever it is to make it your own writing space. Phillip Roth also had a separate office for his writing life. Sometimes having fewer distractions from the outside world makes you a better writer.
What time is Writing Time
When you do write? Are you a night owl, or an early bird? Some writers swear by writing at a certain time. Ernest Hemingway wrote in the morning before the heat of the day started to rise. Joyce Carol Oats also writes primarily in the morning. What time are you most productive at writing? If you are not sure, then maybe write at different times and see what works the best for you. Remember, what work for you at this point in time may not work in the future. Try to always be flexible when it comes to writing time, but not too flexible—you don’t want to get off track completely.
Via: www.bestessaytips.comThe post Different Writing Techniques of Famous Writers Infographic appeared first on e-Learning Infographics.
eLearning Infographics
.
Blog
.
<span class='date ' tip=''><i class='icon-time'></i> Jul 15, 2015 04:32pm</span>
|
|
Six Gap-Closing Classroom Math Strategies Infographic
Educators across the nation are finding that edtech is an important way to break down barriers for all students, no matter where they live or learn. Through digital inclusion, the use of adaptive tools, and engaging game-like programs, the playing field can be leveled to give Latino ELL students—and all students— the skills and confidence to achieve their full potential. The Six Gap-Closing Classroom Math Strategies Infographic offers six strategies you can use in classrooms right now to create a dynamic shift in each learner’s confidence and improvement in math performance.
Utilize bilingual faculty and support staff.
Hire Spanish speaking teachers and support staff to take advantage of Spanish home-language fluency. These human resources can support math learning and English language acquisition both formally through the curriculum and instruction, and informally through classroom interaction.
Set high expectations with a rigorous curriculum.
With Latino ELLs, educators should hold high expectations for every student, work flexibly to meet individual student needs, and avoid adopting a deficit model of student performance.
Use visual contexts and manipulatives.
Using manipulatives, including virtual manipulatives, to teach elementary mathematics is an effective, researched-based best practice
Implement personalized, individualized, and blended models.
Leveraging anytime, anywhere, self-directed learning with the support of technology in and out of the classroom is a powerful way to increase access and provide equal access to quality education.
Use assessment that’s balanced and dynamic.
NCTM suggests that a best practice for ELLs in math is empowering them to demonstrate and explain their understanding in multiple ways.
Increase engagement and motivation
Lessons and classroom experiences that require active involvement can motivate ELL students and engage them in the learning process. Connections to authentic and meaningful contexts help them understand concepts and acquire skills more easily.
DreamBox Learning® Math in English and Spanish for elementary and middle school students provides a standards aligned curriculum, equal access, and scaolded support that builds deep math understanding to reach high standards—in the language that works best for Latino ELLs.
Read laso:
Six Strategies to Reach, Teach, and Close Math Gaps: For Latino English Language Learners in Elementary and Middle School
Via: www.dreambox.comThe post Six Gap-Closing Classroom Math Strategies Infographic appeared first on e-Learning Infographics.
eLearning Infographics
.
Blog
.
<span class='date ' tip=''><i class='icon-time'></i> Jul 15, 2015 04:29pm</span>
|
|
Bringing Our Schools into the 21st Century Infographic
With so many advances in technology, the landscape of education is forever changing for the better. The Bringing Our Schools into the 21st Century Infographic shows how the future can be bright for both educators and students by incorporating advanced technologies and techniques.
High-Speed Connectivity
Less than 30% of schools are set up with the needed broadband connectivity for the use of many Internet educational tools.
President Obama has secured $750 million in pledges from technology companies to bring schools into the 21st century.
Sprint and AT&T will be offering free internet service through wireless networks.
The goal is to provide 21st century technology to disadvantaged schools and access to higher education to lower-income students.
The Cloud
Digital media in the cloud will allow for:
Sharing knowledge
Building strong learning communities
Enhancing communication
Developing a professional educational culture
By 2020 students will be able to shore, learn and network with others at home and in the classroom using multiple devices. Both educators and students can use the cloud to build rich global learning communities online. The cloud can create an opportunity for personalized learning.
Digital Portfolios
Students will be using digital portfolios that can be accessed via various devices. By 2020, there will be an increased reliance on digital portfolios. Digital portfolios will be used as platforms for collaboration with members of learning communities. Digital portfolios will be used to:
Demonstrate knowledge
Apply for college
Apply for job positions
Game-Based Learning
With the challenge of developing students’ math, science and engineering skills, game-based learning is gearing up as a staple educational tool. Game design instructors focus on student engagement and assist students in solving real world prooblems. It can help students develop problem-solving skills and confidence to apply for college or pursue career opportunities. By 2020, more students will be using game based learning programs to braden knowledge, skills and creative thinking.
Via: teacher-degrees.comThe post Bringing Our Schools into the 21st Century Infographic appeared first on e-Learning Infographics.
eLearning Infographics
.
Blog
.
<span class='date ' tip=''><i class='icon-time'></i> Jul 15, 2015 04:29pm</span>
|
|
Complexity and Depth of LMS Course Design Infographic
As technology-enhanced education continues to grow, teachers and administrators have access to more online data—data about course design, user interactions, and learning outcomes. Faced with all this data, it’s tempting to dive in and start making comparisons between courses that tell us how technology is being used and help us ask better questions about teaching and learning. The Complexity and Depth of LMS Course Design Infographic looks at online course design in a new way, by thinking about similarities and differences in course designs, and compiling them into meaningful categories that allow for comparisons, so that we can test ideas about online course design "best practices."
Canvas LMS 101
1,100+ Institutions using Canvas
16M+ Unique users
1.5+ Petabytes of learning data
Annual uptime 99.9%
204K+ Concurrent user peak
Since its formal launch in 2011, the Canvas learning management system (LMS) has hosted 186,337,240 hours (that’s 7,764,050 days or 21,256 years) of fully-online, blended, or hybrid teaching and learning
How Teachers Use Digital Resources
23,770,751+ Activities
84,053,294+ Files or pages
File types used:
Video (1.6%)
Audio (4.6%)
Presentations (15.6%)
Documents (24.1%)
Images (54.1%)
File types by size (in GB):
Images (0.3M)
Audio (0.5M)
Documents (1.3M)
Presentations (1.9M)
Video (3.7M)
How Course Activity Increased Over Time
To understand our data about how teachers design courses in Canvas, we first had to establish a baseline for LMS usage across the institution. We categorized course websites as "active" versus "inactive," where inactive courses didn’t meet a threshold of content or activity for enrolled users. We then counted the number of Canvas higher ed institutions with a low, medium, high, or very high level of active course websites. We then tracked the change in active courses as a percentage of all courses over time.
Navigational COMPLEXITY: We created a machine learning model to predict the navigational complexity of a course website as it may aect students’ ability to accomplish learning goals. Factors include the number of tools and features used and the organization of content and activities.
Feature DEPTH: To help us compare courses, we categorized them by how frequently and how consistently teachers used certain tools or features.
How Complexity Has Changed Over Time
We saw a general trend in higher ed courses on Canvas toward less navigationally complex course design. Each dot represents the average of all active courses in the sample of accounts at each point in time on a 5-point navigational complexity scale.
How Complexity and Depth Relate To Student Outcomes
We found small, but significant correlations between key student outcomes and the depth of feature usage and navigational complexity in course design. Courses with increased feature depth had increased submissions, grades, and interactivity. Conversely, courses with increased navigational complexity had lower submissions, grades, and interactivity.
Which Learning Activities are Favored Relative to Complexity and Depth
We categorized learning activities as assessment-centered, social-centered, or content-centered, We found that 1) most course designs favored content and 2) social learning experiences were associated with deeper feature usage.
How Complexity and Depth Have Changed Over Time
We sectioned course websites into quadrants based on complexity, depth, and the date each institution went live with Canvas. We found that 1) "Simple Deep" courses, which we hypothesize provide easy navigation and intense learning experiences, increased, and 2) "Complex Deep" courses trended downward during the first year after Canvas adoption, possibly because complex course designs were migrated from other learning management systems and simplified in Canvas.
Via: www.canvaslms.comThe post Complexity and Depth of LMS Course Design Infographic appeared first on e-Learning Infographics.
eLearning Infographics
.
Blog
.
<span class='date ' tip=''><i class='icon-time'></i> Jul 15, 2015 04:28pm</span>
|
|
How to Help Our Troubled Teens Infographic
Teens all over the nation are constantly dealing with drugs, depression, violence and mental health disorders. It’s imperative that parents seek the appropriate help at the appropriate time to help their struggling teens. The How to Help Our Troubled Teens Infographic provides stats on how these issues are effecting teens and what parents can do to get help for their teens.
In partnership with students, parents and community, our mission as educators and counselors is to provide a safe and nurturing environment and to facilitate the development of well educated, responsible and productive citizens through a program of instruction and studies that will enable them to grow as individuals, to value differences, and to adapt to an ever-changing world.
We are committed in our belief that all young people are capable of making positive changes in their lives, regardless of the nature of their problems. We believe that all of our students are worthy of a physically and emotionally safe environment. A safe and structured environment provides direction as our students to begin their trek towards making good and proper decisions.
Via: www.sundancecanyonacademy.comThe post How to Help Our Troubled Teens appeared first on e-Learning Infographics.
eLearning Infographics
.
Blog
.
<span class='date ' tip=''><i class='icon-time'></i> Jul 15, 2015 04:24pm</span>
|
|
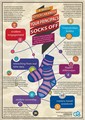
6 Ways EdTech Can Knock Your Principal’s Socks Off Infographic
Investments in educational technology need to show results. As a classroom teacher, employing the right edtech tools can reduce your workload while increasing your instructional impact. The 6 Ways EdTech Can Knock Your Principal’s Socks Off shows how the use of specific edtech tools can give your students insight and empowerment as well as impress your principal.
1. Student Engagement
Recognize achievements using fun badges in the same way games encourage players to continue. ExitTicket.org has the SuperStreak app that recognizes ‘hot streaks’ of correct answers. ClassBadges.com is a free way to design and distribute such rewards. And both tools not only motivate, they focus students on specific learning targets to unlock’ their next achievement.
2. Intervention Hotlist
Maximize your presence in the room by knowing exactly who needs help and with what concepts they need support. Using real time results from ExitTicket, teachers can pull up a list with a single click on who might need to be pulled aside. This is how technology can enhance the teacher’s role and not try to replace it.
3. Reteach with Real Time Data
Capture student engagement critical instructional adjustments just in time. It’s more than simply going over the results, develop a method of analyzing misconceptions with ExitTicket’s ReTeach feature then duplicate the assessment and lock the lesson by retaking the ticket.
4. Differentated Flipped Lesson
Edtech opens the door to new methods of teaching. Flip your class by sending Educreations.com or KhanAcademy.org videos home with your students. In class, use ExitTicket to lD unprepared students for structured remediation while the whole class can take advantage of extra time for engaging projects.
5. Mastery-Based Scorebook
The mastery-based scorebook, sorting grades not just by assignment and dates but by concepts and skills, does more than develop student ownership. Teachers can plan with a deeper, more nuanced perspective of their students’ understanding. Meeting curricular goals is only growing in importance, equip yourself with an assessment system that conveniently tracks students’ growth along state standards.
6. Student Ownership
Transparency and data can empower students. Provide students with a concept map, an organized list of their content standards broken into daily learning goals. Use ExitTicket to import and unpack Common Core Standards, allowing students to see their performance data in each category. It’s their education, giving them sophisticated insight is transformative.
Via: exitticket.orgThe post 6 Ways EdTech Can Knock Your Principal’s Socks Off Infographic appeared first on e-Learning Infographics.
eLearning Infographics
.
Blog
.
<span class='date ' tip=''><i class='icon-time'></i> Jul 15, 2015 04:23pm</span>
|