


Blogs
|
How to Build an Effective Scenario-Based Course Infographic
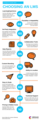
A scenario in an eLearning course is essentially a story. It has a plot, characters, and a problem that the learners resolve. The plot mirrors the workplace reality of the learners. The protagonist has a similar life situation as that of the learners; he shares their goals and aspirations and is plagued by the same workplace woes as they are. He is up against an antagonist that is actually the problem that the course has set out to resolve. The How to Build an Effective Scenario-Based Course Infographic show how you can create an engaging interactive scenario that feels "real" to your learners. They should be able to relate to the protagonist and find him believable when he guides and advises them.
5 Tips to Build an Effective Scenario-Based eLearning Course
1. Identify your target audience and analyze their needs
You have to know, connect to, and empathize with your learners, so you can create relevant, engaging, and effective scenarios.
2. Identify learning needs and outcomes
Learning outcomes are the goals of your course. These are the objectives (one or more) that your course sets out to achieve. Of course, the choice depends on the needs of the learners. If you know your target audience well, you can determine their wants accurately and formulate the outcomes accordingly
3. Choose a situation for the scenario
There may be ample critical situations at the workplace where your learners will be expected to apply their knowledge. But you cannot or should not turn every situation into a scenario. Neither will every situation lend itself to this instructional treatment.
4. Choose the apt scenario structure
There are several types of scenarios. Every type is suited for teaching a particular type of skill. You have to decide which type will facilitate the most effective and effortless transfer of learning from the course to the job.
Different scenario types:
Skill-Based Scenario: the learner is expected to demonstrate skills and knowledge he has already acquired.
Problem-Based Scenario: ideal for situations where learners have to integrate their theoretical and practical knowledge to investigate a problem. Decision-making, logical reasoning, and critical analyses are integral components.
Issue-Based Scenario: learners get to take a stand on issues, usually with humanitarian perspectives, and explore these to understand how these affect decision-making in professional spheres.
Speculative Scenario: learners have to predict the outcome of an event in the future based on their knowledge and deductions.
Gaming Scenario: involves the use of games as learning tools.
5: Design your scenario
Designing a scenario is not just about crafting an engaging story; you have to also ensure it remains instructionally effective.
Read also:
Why You Should be Using Scenarios in e-Learning
The Basics of Scenario-Based e-Learning
Tips To Write Effective eLearning Course Scenario Questions
Top 10 Branching Scenario Techniques
Via: info.shiftelearning.comThe post How to Build an Effective Scenario-Based Course Infographic appeared first on e-Learning Infographics.
eLearning Infographics
.
Blog
.
<span class='date ' tip=''><i class='icon-time'></i> Jul 15, 2015 04:48pm</span>
|
|
10 Things To Consider When Selecting Your LMS Infographic
As the fusion of education and technology proliferates, VET organisations these days have access to a growing range of eLearning systems. With such a wide array to choose from, how do you know which one is right for you?
If you are not from the educational technology field, doing the homework on learning management systems (LMS) can leave your head spinning. With so many LMS options out there in the market - both proprietary and open-source - choosing the perfect one for your VET organisation can be a bit of a minefield. The 10 Things To Consider When Selecting Your LMS Infographic helps you get past the complex terminology and takes you straight to the meat of what really makes an eLearning system outstanding.
1. Learning Experience
Can this LMS deliver a learning experience that suits your students, delivery mode, and organizational goals?
2. Flexibility & Adaptability
Can the LMS be adjusted quickly in respond to feedback you may receive?
3. 3rd Party Integration
How seamless can the LMS be integrated with LTI and SCORM standards, Google Drive, Microsoft Office, VETtrak, eCommerce…?
4. Collaboration Tools
How easy can your students and staff work together and receive instant feedback?
5. DataReports
Can this LMS provide real time, customized reports that tell you what you need to know about student progression?
6. Custom Branding
Is the LMS white-labelled? Can you custom its features, look and feel and workflow?
7. Ability to Localize
In what way can the LMS be customized to suit different student groups, languages or areas?
8. Easy to Scale
Can the LMS handle steep changes in student number in a short timeframe? How easy is it for your organization to scale up and down?
9. Technical Support
Look for an LMS vendor who can actually provide you with ample training and technical support.
10. Pricing & Hidden Costs
Avoid the hidden costs and inflexibility in the future. Test drive the LMS before you buy.
Via: circulus.com.auThe post 10 Things To Consider When Selecting Your LMS Infographic appeared first on e-Learning Infographics.
eLearning Infographics
.
Blog
.
<span class='date ' tip=''><i class='icon-time'></i> Jul 15, 2015 04:47pm</span>
|
|
Financing a College Education Infographic
You got accepted into the school of your dreams, you’re moving out of your parents’ house, everything is lining up perfectly, and the last thing you want to talk about is money. Let’s be honest, everyone knows college can be expensive; however, not a lot of people know how to prepare a budget to be able to overcome the financial burdens of going to college. Luckily this infographic will give you a step-by-step rundown on managing college expenses, so you don’t have to survive on $0.50 packs of noodles and powdered drink mix for the next few years. The Financing a College Education Infographic will help you pave the way to get you through college financially, and be successful after completing your college education.
How to get you through college financially
Start Planning Early. Students and their parents should begin thinking about financing a college education during the student’s sophomore year of high school.
Determine cost of tuition for each prospective school and expected contribution amounts.
Apply for grants and scholarships, using studentaid.ed.gov, finaid.org, fastweb.com.
Families should fill out their FAFSA application at the end of the student’s junior year.
Choose the school that will provide the most financial aid.
Determine the first-year earning potential for careers of interest and compare that to expected cost of loan repayments.
Start thinking about your credit. Open a savings account and contribute 10% of your income.
Pull your credit to make sure you don’t have a credit history due fraud or identity theft.
Start building credit by paying bills and rent on time. Use Experian RentBureau to manage and report rental payments to build your credit history.
Get a part-time or full time job for extra cash to help with living and college costs.
On campus jobs or paid internships may enhance learning and help earn credits or housing stipends.
Open one card and only charge what you can afford, and never pay your bill late.
Monitor your credit with Credit Concierge.
Calculate your monthly expenses and income. If there isn’t enough money left at the end of the month, it’s time to start cutting back.
Always have your student ID card with you to receive student discounts everywhere.
Couponing isn’t just for your parents. Use coupons and student discounts, buy generic, and buy used or discounted textbooks.
Use budgeting tools such as Mintcom and various online banking apps.
After your graduation give your budget a makeover. Factor in any additional income and payments.
Continue to live like a student. Use extra funds for savings or paying down existing debt.
Save! Save! Save! Coupons, discounts and moving back in with your parents can help.
Save money aside for an emergency fund.
Know your debt obligations, when your student loan payments begin, and if you qualify for refinancing or deferment.
Don’t open new credit cards or loan accounts unless it’s on absolute necessity.
Consider consolidating loans to lower interest rates and save money.
Many rewarding careers offer full or partial federal loan forgiveness.
Start investing immediately for your retirement.
Get health, auto, and home or renter’s insurance.
Continue to monitor your credit.
Via: blog.comparecards.comThe post Financing a College Education Infographic appeared first on e-Learning Infographics.
eLearning Infographics
.
Blog
.
<span class='date ' tip=''><i class='icon-time'></i> Jul 15, 2015 04:47pm</span>
|
|
What is Blended Learning Infographic
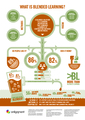
Blended learning is now the strategy of choice for most major employers across the world - but few are taking full advantage of the opportunities it presents. Blended solutions can be so much more powerful than just simple combinations of classroom and eLearning, instead assisting the employee on every step of their learning journey. The What is Blended Learning Infographic provides a broad-ranging, contemporary description of blended learning as defined in the book More Than Blended Learning (Clive Shepherd, 2015). More Than Blended Learning (>BL) is a refreshingly different but simple new approach to the design of learning solutions. Blended solutions combine contrasting learning methods and media in order to maximise effectiveness and efficiency. The More Than Blended Learning approach goes a step further to ensure the blend results in application to real-world tasks and the learner is supported along the whole length of their learning journey.
The What is Blended Learning Infographic looks at four possible ways in which a blend can be accomplished, including the delivery channel, communication mode, learning strategy and social context. It also provides a summary of current research on the efficacy of blended learning (do people like it, does it work), an analysis of what goes into typical blends, as well as a summary of the typical barriers encountered by those looking to implement a blended learning approach.
Via: morethanblended.comThe post What is Blended Learning Infographic appeared first on e-Learning Infographics.
eLearning Infographics
.
Blog
.
<span class='date ' tip=''><i class='icon-time'></i> Jul 15, 2015 04:45pm</span>
|
|
Boost Your Training with the Neuroscience of Education Infographic
Neuroscience of learning has created a wealth of great tips to make L&D more effective. The Boost Your Training with the Neuroscience of Education Infographic shows how knowing about the brain helps L&D people train.
How Neuroscience Can Boost L&D
Learners Become More Engaged
Better Training Creates Cost Savings
Fewer Staff Leave
Training lmpresses Learners
You Can Increase Your Confidence and Credibility as a Practitioner
Trainers Can Confirm Hunches About What Makes L&D Effective
The Field Opens Up Other Perspectives and Creates Discussion
Many professionals know about the neuroscience of L&D, but you can be at the cutting edge of applying it:
64% aware of the neurochemistry of learning - 6% use it
65% aware of brain plasticity - 12% use it
65% aware of learning through "deep practice" - 13% use it
76% aware of generational changes in brain function affect learning - 13% use it
78% aware of cognitive issues around decision making, - 16% use it
71% aware of ‘Mentalising systems’, which are how we process signals from other people and how this affects social learning - 16% use it
71% aware of unconscious thought theory, such as problem-solving through our intuitive mind when we ’re not actively trying - 18% use it
70% aware of learning states during game-based learning - 24% use it
81% aware of the correlationbetween physical exercise and increased learning performance.
- 25% use it
77% aware of human reasoning and logic affect how we learn - 25% use it
64% aware of ‘Mirror neurons’ help embed learning, eg. through role-modeling - 13% use it
5 Neuroscience Findings that Can Help L&D
1. The brain is plastic.
You can use this fact to boost creativity with tasks that make unusual mental connections. E.g. people write better stories when asked to incorporate a set of unrelated words. This strategy automatically raises activity in brain regions associated with creative effort.
2. Space out learning sessions.
An MRI study has shown that we do more unconscious practicing when the learning is spaced out over time. This is true for studying facts, grammar, mathematics and many other topics.
3. Sleep is important for memory.
Our sleeping brain replays activities that reflect our daytime experiences, which helps us to remember better. Quite simply, get learners to sleep more. Also cutting out their caffeine creates much more efficient sleep and learning.
4. Using technology wisely trains brains better.
Late at night, close, bright screens can delay production of a key sleep hormone more than TV. Yet action video games appear to develop cognitive skills like switching visual attention, ignoring distraction and enhancing contrast sensitivity, interestingly, Iaporoscopic surgeons playing these games make far fewer errors.
5. Take regular exercise.
Regular aerobic exercise boosts the efficiency of brain systems important for learning and concentration. Also, exercise stimulates the hippocampus which aids memory. In one study, adults showed a 20% increase in memory performance for words learned straight after two three-minute sprints. e-Learning on the Wii anyone?
5 Brain Friendly Training Ideas
Introduce activities which help delegates process information themselves, for example by sorting information or storytelling.
Find time for active reflection and regular breaks.
Provide information in short bursts, of no more than ten minutes.
Introduce movement and exercise into blended learning situations.
Think about how to create stronger memories with emotion, for example using laughter and happiness or shock and disgust.
View also: How To Use Brain Research For Effective eLearning Development Infographic
Via: cdsmteamblog.co.ukThe post Boost Your Training with the Neuroscience of Education Infographic appeared first on e-Learning Infographics.
eLearning Infographics
.
Blog
.
<span class='date ' tip=''><i class='icon-time'></i> Jul 15, 2015 04:44pm</span>
|
|
Growing and Learning with Mobile Infographic
While educators have been busy trying to understand and teach to Millennials and Generation Y over the past several years, a new generation of mobile natives has been growing in the background. Generation Z, which includes those born after 1995, now fills our K-12 classrooms, and they’ve brought their mobile habits with them. The Growing and Learning with Mobile Infographic will give you a better understanding of the Generation Z students, including the role mobile devices play in their home and school lives.
Mobile Trends around the World
Studies show that, by the year 2017, the percentage of smartphone users in the US will reach 80 percent - triple the percentage of users we saw in 2011. In the UK, this number is set to reach slightly more than 80 percent, while in China and India, the percentages are set to rise at a slower rate. Globally, mobile learning is growing at a rate of 18.2 percent per year, suggesting that learning organizations will need to adopt appropriate technologies in order to keep up with growing demand.
Mobile in the Classroom
Today’s middle schoolers use mobile devices for everything from checking grades to writing papers. Of those students using mobile devices:
78% use devices to check grades
69% to take notes
56% to access text books
64% to write papers
Teachers are also on the move, with 35% using a tablet or e-reader in class in 2013, up 20% from 2012.
Impact on Student Achievement
Studies show that standardized test results are higher in classes where students have access to mobile devices. In one case, test scores of low-income students climbed as much as 30 percent after being given access to smartphones - an increase attributed to the fact that students were able to keep connected with teachers and classmates, even while at home.
Via: www.itslearning.netThe post Growing and Learning with Mobile Infographic appeared first on e-Learning Infographics.
eLearning Infographics
.
Blog
.
<span class='date ' tip=''><i class='icon-time'></i> Jul 15, 2015 04:41pm</span>
|
|
How to Help Shy Kids Break Out of Their Shell Infographic
As your children grow up, you want them to be able to grow into their own skin and explore the world around them so that they can become well-rounded individuals. However, this can sometimes be tough, because children will naturally shy away from new situations that they find uncomfortable. What can you do to help your son or daughter break out of his or her shell? The How to Help Shy Kids Break Out of Their Shell Infographic provides a few tips that will help you learn more about your child’s shyness so that you can relate and help foster positive development.
1. Nurture your child’s needs with responsive nurturingIt helps sensitive children learn to calm themselves and manage their reactions.
Heightened sensitivity becomes an asset.
Makes them more responsive to their peers’ needs.
Can better negotiate group situations.
2. Emphasize your child’s worries and don’t shame them
Helps them develop empathy.
Enhances social skills and connect with others.
Don’t use negative judgment.
3. Model confident behavior
Be Friendly to strangers, help others.
Kids learn from watching us.
4. Teach your child basic social skills to use with adults and children
Make eye contact smile
Smile
Shake hand
Respond to polite chit-chat.
5. Help your child learn to make new friends
Role play how to interact with other kids.
Successful kids observe first and find a way to fit into a group.
Read books about social skills with your child.
6. Don’t label your child as shy
Children need to feel confident handling situations when parents aren’t around.
Roleplaying helps manage anxiety.
7. Coach your child to express his/her needs and stand up for himself/herself in social situations
Acknowledge his/ her worries.
Let him/her know they can overcome their fears.
8. Teach effective strategies for dealing with feelings
Accept nervousness as a part of normal life,
Reassure yourself that you’re okay.
Focus on others than yourself.
9. Provide daily opportunities to interact with others
Socially anxious kids need downtime.
They also need to practice social skills.
10. Don’t push your child to perform
Some kids like to perform, others don’t.
Make him/her feel valued either way.
11. One good friend is worth many acquaintances
Your child should have someone to talk to.
They don’t have to be the life of the party.
12. Don’t teach your child to be afraid of strangers
It creates anxiety
Your child can trust you, a teacher, or babysitter,
13. If your child is usually fearful, they need to express themselves
Repressing fears makes things worse.
Makes kids more fearful and rigid,
Try to have them release anxiety
14. A good way to test your children’s ability to be independent
Enroll them in sleepaway camp They will gain:
Independence
Social skills
Friendships
Healthy attitudes
Team-building
Via: riverwayranchcamp.comThe post How to Help Shy Kids Break Out of Their Shell Infographic appeared first on e-Learning Infographics.
eLearning Infographics
.
Blog
.
<span class='date ' tip=''><i class='icon-time'></i> Jul 15, 2015 04:39pm</span>
|
|
2015 Global eLearning Salary & Compensation Report Infographic
The 2015 Global eLearning Salary & Compensation Report Infographic gives some of the highlights from The eLearning Guild’s 2015 Global eLearning Salary & Compensation research report, which examines trends in pay for eLearning professionals, exploring global and regional salary trends and breaking down salary by variables including industry and company size. The report is based on the responses of 5,127 The eLearning Guild members, who provided their salary and compensation information as part of their membership data. The 2015 Global eLearning Salary & Compensation Report Infographic highlights gender-based income disparities, salary differences among Unites States metropolitan areas, how many people received merit increases in the past year, hours worked per week around the world, who gets the most vacation days, and who earns the most.
In the annual Guild Research report, the 2015 Global eLearning Salary & Compensation Report, Sharon Vipond and Janet Clarey examine trends in pay for eLearning professionals. The data is broken out by region and includes variables such as industry segment, company size, employee designation, years of experience, job-focus area, education level, and gender.
The average global base salary is up 2.5 percent from last year, and the average base US salary is up 2.7 percent. In the US, salaries vary substantially between metropolitan areas: In the San Francisco Bay Area, the average salary is $101,410, compared with $65,249 in the Detroit metropolitan area. The report includes a link to The eLearning Guild’s salary calculator, which allows users to compute and compare baseline salaries for their own situations. New to the report this year are a number of features and resources, including leading practice guidelines, tools, references, and other important resources. And if your salary doesn’t measure up, the report also includes an action plan.
Via: twist.elearningguild.netThe post 2015 Global eLearning Salary & Compensation Report Infographic appeared first on e-Learning Infographics.
eLearning Infographics
.
Blog
.
<span class='date ' tip=''><i class='icon-time'></i> Jul 15, 2015 04:38pm</span>
|
|
African American STEM Leaders Infographic
African American mathematicians, scientists, and inventors have contributed to our nation’s greatness since the time of President George Washington. The African American STEM Leaders Infographic highlights the contributions of just seven of the many African Americans who have changed our world from the 1700s to the present.
1. Benjamin Banneker
Son of a slave, this mathematician was also an astronomer, inventor, and writer. Acclaimed for the almanacs he published between 1792 and 1798, Banneker was appointed by President George Washington to the District of Columbia Commission and helped map out the new national capital. In 1980, the U.S. Postal Service issued a stamp in his honor.
2. George Washington Carver
Scientist, inventor, botanist, and chemist, Carver invented over 100 products derived from the peanut. Born into slavery, he became one of the most prominent scientists and inventors of his time. A teacher at the Tuskegee Institute, the agricultural department achieved national renown under his leadership. A monument showing him as a boy was the first national memorial erected in honor of an African American
3. Euphemia Lofton Haynes
Academic, social activist, and the first African American woman to receive a PhD in mathematics. Not only a mathematician, Haynes was a distinguished educator, activist for school desegregation, and a fellow of the Association for the Advancement of Science.
4. George Carruthers
This astrophysicist was inducted into the National Inventors Hall of Fame for his contributions to aeronautical engineering. Carruthers patented the "Image Converter," which detects electromagnetic radiation in short wave lengths. In 1970, his invention recorded the first observation of molecular hydrogen in outer space. In 1972, he invented the first moon-based observatory, which was later used during the Apollo 16 mission. Carruthers received the National Medal of Technology and Innovation in 2013.
5. Valerie Thomas
This physicist and inventor invented 3D TV. Thomas received a patent in 1980 for inventing an illusion transmitter that extends the idea of television and makes images look three-dimensional. From 1964 to 1995, she worked in a variety of capacities for NASA where she developed real-time computer data systems, conducted large-scale experiments, and managed many operations, projects, and facilities. Thomas’ team spearheaded "Landsat," the first satellite to send images from space.
6. Mae C. Jemison
The first African American woman to travel in space, she is also a physician, professor, and entrepreneur. Jemison joined the space program after she completed her medical degree, maintained a general practice, and served in the Peace Corps. After working at NASA from 1987 to 1993, Jemison founded The Jemison Group, Inc., which developed a satellite-based telecommunications system to improve health care delivery in developing nations. A professor in the Environmental Studies Program at Dartmouth College, she directed the Jemison Institute for Advancing Technology in Developing Countries.
7. Neil deGrasse Tyson
This astrophysicist, writer, and television personality is bringing a love of science and information about the cosmos into our homes. A writer, Tyson has authored 10 books, and co-wrote and hosted the PBS-NOVA series, Origins. The recipient of eighteen honorary doctorates and the NASA Distinguished Public Service Medal, he is executive editor, host, and narrator for Cosmos: A Spacetime Odyssey. He heads the Hayden Planetarium in New York City and is a research associate of the Department of Astrophysics at the American Museum of Natural History.
Via: www.dreambox.comThe post African American STEM Leaders Infographic appeared first on e-Learning Infographics.
eLearning Infographics
.
Blog
.
<span class='date ' tip=''><i class='icon-time'></i> Jul 15, 2015 04:37pm</span>
|
|
10 Ways eLearning Maximizes ROI Infographic
There was a time when training was seen as a necessary evil. Necessary because no organization can function without it, and evil because it was a huge expenditure - of time, money and other resources. Employees had to skip work in order to receive training and that meant days of lost revenue for the organization. Training is now an investment. Because knowledge and expertise is now an asset for the organization. The top 20 per cent of the workforce generates 80 per cent of the business, and the only way to reap the benefits of this top 20 per cent is by creating a vibrant learning culture. The 10 Ways eLearning Maximizes ROI Infographic presents how eLearning can increase the return on investment.
10 Ways eLearning Maximizes ROI
1. Saves Time
Technology based training saves up to 45% time than classroom based training because it’s asynchronous & self-paced
2. Saves Money
Eliminates the need to physically travel to point of training
3. Minimizes time away from the job
When employees cover a course on their laptop or PC, they save those many hours of being away from the job.Interesting courses encourage learning to happen even beyond office hours
4. Highly Cost-effective
It is one of the most effective, fast & economical methods to impart training today, considering the number of employees it can serve
5. Highly Flexible
Can be delivered irrespective of geographical locations & in multiple languages. Gives more control to learners
6. Maintains Consistency
Same quality of content for all employees as it is free from the influences of the personal characteristics of the trainer
7. Delivers Personalized learning
Analytics & educational data mining tools can tailor & enhance learning to make it more relevant for each employee
8. Greater Information Retention
Can achieve far greater engagement by integrating interactive elements like quizzes, situational analyses& scenarios
9. Greater Customer Satisfaction
Just-in-time support improves on-the-job performance enabling employees to service customers better
10. Lower Employee Turnover
Greater employee satisfaction & loyalty results in lower costs on hiring & training new staff
Via: blog.originlearning.comThe post 10 Ways eLearning Maximizes ROI Infographic appeared first on e-Learning Infographics.
eLearning Infographics
.
Blog
.
<span class='date ' tip=''><i class='icon-time'></i> Jul 15, 2015 04:35pm</span>
|