


Blogs
|
20 College Scholarships Infographic
So you’ve finally been accepted into the school of your dreams. A future full of outdoor campus study sessions and more caffeine than any sane individual would consider lies in front of you. Now you just have to pay for it. Are you worried where that first tuition check will be coming from? Than you are officially no different than the vast majority of college bound students across the country. As tuition prices continue to rise more and more students are faced with the increased stretch of a higher education that seems financially out of their reach. Well kids, take a deep breath and take a load off your, or your parents, wallet with this list of 20 college scholarships with easy applications from your friends over at Compare Cards.
College Scholarships with Easy Applications
American Fire Sprinkler Association Scholarship
Cappex Monthly Scholarship
College Week Live Scholarship
College Xpress Scholarship
Common Knowledge Scholarship
Countdown to College Scholarship
Courage to Grow Scholarship
Frame My Future
Horatio Alger Scholarship
No Essay Scholarship
Peterson’s Create-a-Greeting Card Scholarship
ROCKtheSAT Scholarship
Sallie Mae
Scholarship Detective
Scholarship Experts Scholarships
Scholarship Points
Scholarship Zone Scholarship
Unigo Scholarship
US Bank Scholarship
Zinch Weekly Scholarship
View also: The Ultimate Guide to Earning a Scholarship Infographic
Via: blog.comparecards.comThe post 20 College Scholarships Infographic appeared first on e-Learning Infographics.
eLearning Infographics
.
Blog
.
<span class='date ' tip=''><i class='icon-time'></i> Jul 15, 2015 05:06pm</span>
|
|
Millennials and Media Consumption Infographic
The millennial generation has been a game-changing demographic group for both advertisers and marketers. Glued to smart technology, this tech-savvy generation wants information instantaneously. As this group is quickly becoming a large consumer base, advertisers are seeking to tap into their buying potential. The Millennials and Media Consumption Infographic breaks down this generation’s demographics and media viewing habits.
Who Are the Millennials?
Gender Breakdown:
47% Male
53% Female
Race Breakdown:
18.5% Hispanic
14,2% Black
4.3% Asian
3.2% Mixed
59.8% White
Main News Source
It wasn’t too long ago that newspapers and radio were the leading news sources. This technology friendly generation prefers to find their news elsewhere:
Television 65%
Internet 59%
Newspaper 24%
Radio 18%
Media Engagement
The millennial generation takes media consumption and engagement to an all-time high.
Millennials spend 18 hours a day consuming media
72% use free streaming video such as Youtube and Hulu making it the no 1 used viewing source.
60% use subscription video on demand Netflix, Amazon Instant Video etc.)
46% use pay TV
22% of media viewing time is dedicated to traditional TV series
17% of media viewing time is dedicated to Youtube/Classess/Gameplay
14% of media viewing time is dedicated to movies and sports
50% of millennials watch an online video at least once per day
Why are millennials choosing online viewing?
Immediate access 56%
Multitasking 49%
Convenience of viewing location 44%
Social Media and Mobile Engagement
5.4 hours per day on social media
Over 65% of millennials embrace brands on social media
71% engage in social media daily
71% use hyper-targeted radio like Pandora, iHearRadio and Spotify
Check smartphones 43 times per day
View also:
The Managing Millennials Infographic
Engaging Millennials Using Social Learning Infographic
The eLearning Principles for Teaching Millennials Infographic
The Life of a 27 year old in America - Millennials Infographic
Via: www.koeppeldirect.comThe post Millennials and Media Consumption Infographic appeared first on e-Learning Infographics.
eLearning Infographics
.
Blog
.
<span class='date ' tip=''><i class='icon-time'></i> Jul 15, 2015 05:05pm</span>
|
|
Classroom Accommodations for Dyslexia Infographic
For kids with dyslexia, reading and writing can be challenging. The Classroom Accommodations for Dyslexia Infographic presents some common ways schools can make learning more accessible. Keep in mind that the accommodations listed here aren’t the only ones available. Talk to your child’s teachers for more ideas.
For Materials
Get audiobooks through service like Bookshare, a free online library for students with disabilities.
Provide pictures of directions and schedules.
Use large-print text for worksheets.
Simplify directions with key words for most important ideas.
Provide colored strips or bookmarks to follow along when reading.
For Teaching Techniques
Give step-by-step instruction (oral and written).
Repeat directions, then check to see if students understand.
Stick to consistent daily routines.
Use small group teaching.
Provide notes from the lesson, or organizers to fill in and follow along during the lesson.
Review skills daily.
Pre-teach new and important concepts.
For Classwork and Taking Tests
Teachers can…
Provide extra time for reading and writing.
Provide different ways to respond, like saying the answers, having larger spaces for writing, or circling an answer instead of filling in the blank.
Hand out letter and number strips for students to look at so they can see how to write correctly.
Provide sentence starters that show how to begin a written response.
Show examples of work that is correct to serve as a model.
Arrange worksheet problems from easiest to hardest.
Allow understanding to be demonstrated in different ways (oral reports, video presentations, posters, etc.).
Students can…
Use a text reader (like a Reading Pen or text-to-speech software).
Partner up to study-one person writes while the other speaks, or they share the writing.
View also:
How to Make Your Classroom Dyslexia Friendly Infographic
Understanding Dyslexia Infographic
Special Education Accommodations Infographic
The post Classroom Accommodations for Dyslexia Infographic appeared first on e-Learning Infographics.
eLearning Infographics
.
Blog
.
<span class='date ' tip=''><i class='icon-time'></i> Jul 15, 2015 05:02pm</span>
|
|
Why You Should Invest in Talent Management Infographic
Talent Management seems to be a bit of a fashionable buzzword for a lot of organizations. But is it really important or is it just another business fad? Talent Management covers a range of practices with the goal to recruit and keep the most talented and skilled employees available. Should you think more about managing talent? In short - yes! That is, if you don’t want to lose your best staff and most important assets to another organisation that invests in it’s people. Still need convincing? The Why You Should Invest in Talent Management Infographic peresnts 10 reasons why you should invest in talent management.
10 Reasons Why You Should Invest in Talent Management
1. Get the right person for the job
When you look at people’s skills and strengths, you’ll see a best fit for each role. Competency mapping used in talent management allows you to take stock of skills in your organization. This results in both increased productivity and job satisfaction.
2. Empower and impassion your staff
If you view staff simply as a number, you need to realize that they know this. On the other hand, if you value them, invest in them and their future, they will work for the greater good of the organization rather than just a pay check.
3 . Encourage loyalty
You’ll encourage loyalty from your staff (especially important with the younger generation). People now prefer flat organizational hierarchies, build careers around jobs and want a clear performance management system.
4. Close the organizational skills gap
The performance difference between talented people and those with less talent is huge. Employees and how they are managed is an important source of organizational competencies and strengths.
5. Retain top talent
Beware of losing your best staff to your competitors! Focus should be on employee retention programs and strategies to develop and engage staff, therefore keeping quality people.
6. Make fewer hiring mistakes
The quality of an organization is, quite simply, the quality of staff it has. Many talent management programs implement hiring assessments as part of the recruitment and selection process.
7. Understand your staff better
Employee assessments give great insights about your team. This helps in planning personal development as you will understand their needs, career aspirations and strengths and weaknesses.
8. Make better professional development decisions
This benefits your team and your company. When you get to know who has high potential, it becomes easier to invest in their future professional development and to align these plans with your company vision.
9. Employees will feel valued
Having a strong talent management culture also determines how employees rate their organizations as workplaces and how much they feel part of the culture. Your employees will feel valued and therefore motivated.
10. Increase staff confidence
If employees are positive about your talent management practices, they are more likely to believe the vision of the organization. The result is a workforce that is engaged, committed and determined to do what is best for your company.
Mananging talent with Totara LMS
Puttinlg emphasis in the person not the course, Totara LMS allows you to better manage performance right across your organization. This is a solution for aligning talent development with organizational strategies to meet the challenge of moving towards a performance management culture.
Learning Pool was named as Totara Top Seller 2014
Learning Pool gained this recognition for their continued success and exponential growth in the learning management system market. In addition, they also boast unrivalled implementation of the system, as the only Totara Partner to win a recent E-learning Age Award for Best LMS Implementation with hotel chain Jurys Inn.
Via: www.learningpool.comThe post Why You Should Invest in Talent Management Infographic appeared first on e-Learning Infographics.
eLearning Infographics
.
Blog
.
<span class='date ' tip=''><i class='icon-time'></i> Jul 15, 2015 04:59pm</span>
|
|
Why 2015 Should Be the Year You Learn to Code Infographic
Learning how to code offers many advantages for anyone seeking new opportunities in the new year. No matter what your current age or job title is, a wide range of industries are eager to hire people with programming knowledge. Even if you are just interested in learning to code for a side project or a personal website, it’s a great way to learn new skills and challenge yourself to work towards a goal. The Why 2015 Should Be the Year You Learn to Code Infographic presents ten reasons to make 2015 the year you learn to code.
10 Reasons to Make 2015 the Year You Learn to Code
1. Advance your career without having to go (or go back) to a university.
Learning to code can be a cheaper option than going to a university. It takes on average 3 months instead of 4 years, and it costs between $10k-20k instead of $50k-200k.
2. There will be more programming jobs in the future than programmers to fill them.
By 2020, there will be 1.4 million computing jobs available, with only 400,000 people qualified to fill those jobs.
3. Better understand what is happening in your own business.
Learning how to code can help you have a better understanding of the technological aspects of your company and to better communicate with your technology team.
4. Keep up with the jobs of the future.
Being able to code is an increasing skill that will keep you essential in the future job market. The number at coding jobs in America is set to grow 30% by 2020 understanding programming will be important to almost any job at the Future.
5. Save money when starting your own company.
Starting your own company can be expensive. Not having to hire a programmer in the initial stages can save money that can be spent on other aspects of your business.
6. Keep up with younger generations.
Kids are learning to code through the Hour at Code program all over the United States. To keep up with the younger generations, learning to code could put you higher on the list.
7. Have a more flexible work schedule.
Many coding jobs provide flexibility and independence. Being able to work from your computer allows you to work from anywhere, at any time.
8. Increase your salary.
Computer science offers some of the highest paying salaries. The average base salary of a software engineer in the US is getting closer to $100,000.
9. Coding gives you a mental workout.
Developing thoughts and organizing them in a logical order can be difficult. Learning to code.
10. You’ll have more options in the job market.
Working at a startup or working for a large corporation are all options for you when you learn to code. It just comes down to your personal preference!
View also:
Why We Should All Learn Coding Infographic
5 Reasons to Teach Kids to Code Infographic
Via: blog.ironhack.comThe post Why 2015 Should Be the Year You Learn to Code Infographic appeared first on e-Learning Infographics.
eLearning Infographics
.
Blog
.
<span class='date ' tip=''><i class='icon-time'></i> Jul 15, 2015 04:58pm</span>
|
|
LMS Evolution or Extinction Infographic
Is the Learning Management System (LMS) headed for extinction? No, actually the reality is far from it. After all, the LMS is really the heart of any effective talent management strategy. However the role of the LMS within the organization is clearly evolving across a number of very important key aspects.
The LMS Evolution or Extinction Infographic presents the nine key trends that are currently changing the role of an LMS. You will want to be sure to keep each of these trends in mind to assure that your LMS will meet your organization’s needs both today and as they evolve in the future.
1. Informal & Social Learning
It is estimated that at least 75% of learning is informal:
collaboration
communities of practice
user-generated content
What to consider for your LMS
Ease of integration with corporate social networks
Syndicated search & expertise locator
Gamification options & capabilities
Performance support ("the 5 moments of need")
Key question: Are you looking for a "socialized" LMS application or for an LMS as the social platform of choice?
2. Mobility
Mobile learning is
Personalized access
Context- & location-aware content
Performance support
Mobile learning is not
eLearning on smartphones
What to consider for your LMS
Clear strategy with objectives: evolution or revolution?
Responsive design across choice of devices
Native apps optimized for real-world use cases
Connectivity - what happens if a user is of ine?
Device & platform choice - lots of pros & cons
Key question: Should you leverage your existing learning content investment or start fresh with new mobile-speci c content?
3. Compliance
2 out of 3 organizations say that demonstrating compliance is very important to them
1 out of 2 organizations are relying on their LMS to demonstrate compliance
Only 1 out of 3 are ready for a compliance audit (for low performing organizations)
Only 2 out of 3 are ready for a compliance audit (for high performing organizations)
What to consider for your LMS
E-signatures in audit tracking
Competencies & certifications
Pro-active reporting, dashboards & analytics
Easy access to compliance content
Key question: Are compliance checklists & reactive reporting enough from a risk perspective vs. true workforce readiness & proactive compliance dashboards?
4. The Extended Enterprise
Franchise networks
Supply chains
Distribution channels
End clients (B2B and B2C)
What to consider for your LMS
Portals, branding & personalization
E-commerce capabilities
A new role of the LMS
- Revenue generation
- Quality management
- Documentation distribution
- Partner certifications
Key question: Can you leverage the same LMS investment for both internal & external audiences?
5. The Cloud
Disruption in every business
Predictable total cost of ownership
Rapid innovation
Global accessibility
Easy administration
On-demand self-service
Elastic capacity
What to consider for your LMS
Data hosting location for data privacy
Control over software updates - is it important?
Customizations - yes or no?
Security of application infrastructure & standards (ISO/IEC 27001)
Support for industry-specific regulatory and legal requirements
Key question: How much of your learning strategy are you willing to outsource or commoditize?
6. Integrated Talent Management
Ongoing performance management Learning management Succession management & talent pools Compensation Workforce analytics
What to consider for your LMS
Organic integration or collection of acquired technologies?
User experience - seamless or
Big (or small) data analytics across the full spectrum for unified decision making
Key question: How much of best-of-breed functionality & user experience is sacri ced in an ? integrated suite?
7. Security & Privacy
Global Services Organization Confirms Illegal Attack on Information Technology System News Release: A global services organization has confirmed today that the posting of certain data les on the Internet yesterday was the result of an illegal attack. We are conducting a full review of the nature and extent of the attack. At this time, we do not believe that the attack extended beyond data pertaining to a learning management system for a government agency
What to consider for your LMS
Authenticity - validated identity authentication (e.g. e-signatures or physical identification)
Integrity - secure infrastructure (e.g. ISO 27001)
Confidentiality - data privacy & control (e.g. Secure SaaS)
Availability - system architecture (e.g. intrusion/DOS detection & prevention)
Auditability - tracking & reporting
Regulations (e.g. 21 CFR Part 11, EU GMP Annex 11)
Key question: What people data or information do you think might be at risk in your L&D or HR department?
8. Analytics
What to consider for your LMS
Level of confidence in the accuracy & integrity of currently available data
Self-service reporting capabilities, time & effort required for a new report
Graph charting & visualization options
Ability to integrate data from multiple sources
OLAP technology & predictive modeling
User experience at all levels: administrators, business line managers, HR directors, executive team
Key question: Are you able to get started with analytics by focusing on small data that are already available to you before tackling big data?
9. Client Satisfaction
What to consider for your LMS
Market consolidation - has your LMS provider been acquired (or re-acquired)?
Level of attention & knowledgeable client support that you are receiving
ROI on your LMS - can you calculate it?
Ability to tailor your system to your specific business needs
Hidden costs along the life of your LMS contract
Key question: Would you recommend your current LMS provider?
Via: na-sjl.marketo.comThe post LMS Evolution or Extinction Infographic appeared first on e-Learning Infographics.
eLearning Infographics
.
Blog
.
<span class='date ' tip=''><i class='icon-time'></i> Jul 15, 2015 04:57pm</span>
|
|
Music Lessons Make You Smarter Infographic
Want to sharpen up your mind and have fun while you’re at it? Music lessons, such as singing or guitar lessons, are much more than just a creative pastime - they can help you relieve stress, develop self-confidence, and believe it or not, even make you smarter. The Music Lessons Make You Smarter Infographic shows some of the learning benefits gained from music lessons, especially at an earlier age. Music lessons can help not only with mathematics but also with reading comprehension. Even some of the most recognized names in science and invention had some musical training.
What Do These Great Minds Have in Common?
Leonardo da Vinci
Isaac Newton
Benjamin Franklin
Albert Einstein
Thomas Edison
Galileo Galilei
Condoleezza Rice
Bill Clinton
Allan Greenspan
Bill Gates
Steven Spielberg
Neil Armstrong
They were all musicians. Coincidence? Certainly not! Scientific studies prove that music education helps to develop smarter, more successful students who grow into more productive adults.
Improved Math Skills
In a study of 96 children ages 5-7 years old, those who received 7 months of supplementary music and arts classes earned higher mathematics scores than those with the schools’ typical music and arts training.
Improved Reading Skills
In a collection of 24 studies, with sample sizes of over 500,000 high school students researchers found a strong correlation between music instruction and higher reading test scores.
Improved Memory
In a study of 90 children ages 6-15 years old, those who engaged in music training had significantly better verbal memory. Longer training led to even greater verbal memory.
Improved IQ
A study of 132 children were divided into 4 groups; their IQs were tested before and after with the full Wechsler intelligence test.
Full Scale IQ score before:
No lessons 99.4
Drama 102.6
Keyboard 102.6
Voice 103.8
Full Scale IQ score after:
No lessons 103.3
Drama 107.7
Keyboard 108.7
Voice 111.4
Results: Students who engaged in keyboard and voice lessons had the greatest increases in IQ.
Improved SAT Scores
A study of 500 high school students found that those who engaged in some form of music lessons scored:
57 points higher in verbal comprehension
41 points higher in math
Improved Planning
Students who are rhythmically skilled tend to plan, sequence, and coordinate actions in daily tasks better.
View also:
How Music Affects Learning Infographic
The Benefits of Music Education Infographic
Via: takelessons.comThe post Music Lessons Make You Smarter Infographic appeared first on e-Learning Infographics.
eLearning Infographics
.
Blog
.
<span class='date ' tip=''><i class='icon-time'></i> Jul 15, 2015 04:55pm</span>
|
|
Nurturing the Middle School Mathematicial Mind Infographic
The middle school mind is…different. As 13-year-old Logan LaPlante described in his Ted Talk Hack Schooling Makes Me Happy, "Neuroscientists say that the teenage brain is pretty weird: our prefrontal cortex is underdeveloped, but we actually have more neurons than adults, which is why we can be so creative, and impulsive, and get bummed out." Truer words were never spoken around this subject. To reach and teach the middle school math mind, understanding its inner workings and leveraging current best practices just makes sense. The Nurturing the Middle School Mathematicial Mind Infographic provides some answers to who middle school students are, how they learn, and classroom strategies to make sure they stay engaged at this extremely critical time in their learning lives.
Who Are Middle School Students?
Independent: Support a strong sense of self. Value and leverage each student’s unique prior knowledge and reasoning abilities to nurture confidence. Provide independent think time as students transfer critical thinking to new situations and contexts.
Emotional: Be aware of and learn to temper extremes. They often "love" or "hate" and are "good at" or "bad at" everything-including math. They are nervous and trying to cope with changes. Nurturing a growth mindset and connecting math to real life helps offset "all or nothing" attitudes.
Social: Make math port of being "in with the in crowd". It’s all about being a valued part of the group. Engaging with peers and cultivating relationships in learning experiences helps create a true community of mathematicians.
Students’ Personal Access Mobile Devices Grades 6-8
73% Use Smartphones
66% Use Laptops
61% Use Tablets
48% Use Digital Readers
How Middle School Students Learn
Collaboratively: Honor, hear, and discuss every student’s personal ideas, strategies, and contributions.
Individually: Let them work at their own pace and learning style and take ownership of their learning.
Technologically: Leverage blended learning that takes advantage of new interfaces which encourage students to explore new ideas.
Of 100 middle school students, 93 want to go to college
Of those, 70 graduate from high school
Of the high school graduates, only 44 enroll in college
Of those enrolled in college, only 26 will successfully earn a college degree
How Can You Teach to Reach Middle School Students?
Engagement: Try Gamification. The evolution and expansion of educational software with game-like protocols and rewards capture the imagination and drive persistence
Connectedness: Try Blended Learning and Community Conversations. A valuable approach for students to express challenges and problem solve together.
Motivation: Try Challenging with Difficult Problems. Provide unique challenges that are purposeful, personalized, and thought provoking. Build confidence by making sure every student’s needs are met.
Independence: Try an Adaptive Program. Build ownership while providing a supportive platform for guidance. Goal setting and progress monitoring support independent learning pathways and a sense of accomplishment.
Only 35% of 8th grade students are math proficient. How can we change that statistic?
By building middle school mathematicians who are:
Critical thinkers with a growth mindset that enables them to tackle complex problems in unique and effective ways.
Students who are given learning opportunities for authentic engagement with content, development of conceptual understanding, and achievement of procedural fluency.
Curious, self-directed learners who persist through even the most challenging problems.
Via: www.dreambox.comThe post Nurturing the Middle School Mathematicial Mind Infographic appeared first on e-Learning Infographics.
eLearning Infographics
.
Blog
.
<span class='date ' tip=''><i class='icon-time'></i> Jul 15, 2015 04:54pm</span>
|
|
Flipped Learning: The Big Picture Infographic
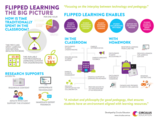
As we progress rapidly into the middle of the second decade of the 21st century, questions continue to be raised about how education addresses the ever increasing demands for change, integrating emerging technologies, and maximising the possibilities for every student. Teachers are searching for ways to focus on engaging students in authentic, complex and powerful problem solving experiences for learning, unpacking content and demonstrating understanding and knowledge. The day is a finite resource, and class times are small segments of that day, so there are limitations on how much more can be accomplished in that specified time.
Flipped Learning shifts the classroom from passive to active learning, focusing on higher order thinking skills such as evaluating, analysing, and creating to engage students in learning. The approach relies on understanding the difference between information and knowledge acquisition, providing students with active learning possibilities. Students are given opportunities to take greater responsibility for their own learning. Class time focuses more on exploration, finding meaning and application of knowledge. Teaching is focused more on providing significant learning opportunities, providing feedback through a variety of pedagogical strategies and ensuring understanding.The Flipped Learning: The Big Picture Infographic shows how schools engaging the Flipped Learning approach focus on the development of a flexible environment.
Flipped Learning Enables:
Student access to tools and technologies
Student engagement in rigorous content
Student immersion in diverse learning
Student collaboration with peers
Support for the learning process
Student access to immediate expert feedback
Flipped Learning in the Classroom:
Encourages student understanding
Enables differentiation
Ensures access to expert support
Enables student engagement
Creates a supportive learning environment
Provides opportunities for collaboration
Flipped Learning with Homework:
Encourages student accountability
Encourages purposeful homework
Provides a reason for learning content
Minimizes distractions
Engages and prepares students for learning
Read also:
The Flipped Classroom Guide for Teachers
View also:
Effective Strategies to Flip the Classroom Infographic
How a Flipped Classroom Works Infographic
Flipping the Classroom Infographic
6 Steps to Flipping A Classroom Infographic
Growth in Flipped Learning Infographic
The Flipped Classroom Infographic
Via: circulus.com.auThe post Flipped Learning: The Big Picture Infographic appeared first on e-Learning Infographics.
eLearning Infographics
.
Blog
.
<span class='date ' tip=''><i class='icon-time'></i> Jul 15, 2015 04:51pm</span>
|
|
The DNA of a Top Deck L&D Team Infographic
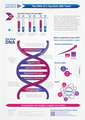
The 2014 Towards Maturity Benchmark takes a fresh look at the learning leaders - the Top Deck (those in the top 10% of the Towards Maturity Index). Across the board, these organizations are more than twice as likely to achieve the benefits they seek from a modernized learning strategy and report 35% fewer barriers than their peers. The DNA of a Top Deck L&D Team Infographic will help you turn data into insights and insights into actions that deliver real results for you and your learning team in 2015. Use it to stimulate conversation with your L&D team and with your CEO if you want to demonstrate how you can add value by building market competitiveness, business agility and talent.
Via: towardsmaturity.orgThe post The DNA of a Top Deck L&D Team Infographic appeared first on e-Learning Infographics.
eLearning Infographics
.
Blog
.
<span class='date ' tip=''><i class='icon-time'></i> Jul 15, 2015 04:50pm</span>
|