


Blogs
|
Getting Your Child Ready for Kindergarten Infographic
The Getting Your Child Ready for Kindergarten Infographic features everyday things families can do to make sure their child enters Kindergarten ready to learn. When a child enters kindergarten ready to learn, they start building a foundation for school success.
Top 6 Ways to Get Your Child Ready for Kindergarten
Read every day
Reading books, street signs and other words in your child‘s world increases vocabulary, knowledge and ability to recognize letters and words.
Talk with your child
Use language to describe emotions and behaviors, and surroundings, activities, and objects. Ask your child questions and give them opportunities to ask questions, too!
Give choices
Even small choices, like which shirt to wear, can help build your child’s confidence and develop independence.
Model positive problem solving
Use positive words in your household to resolve conflicts and help your child understand the consequences of his or her actions, and how those actions can affect others.
Encourage imagination and creativity
Children are more likely to be good problem solvers when they can use play to learn and express themselves.
Provide different opportunities to learn
Early experiences in Science, Technology, Engineering, and Math (STEM), supports academic growth, and develops early critical thinking, reasoning and language skills.
Via: papromiseforchildren.comThe post Getting Your Child Ready for Kindergarten Infographic appeared first on e-Learning Infographics.
eLearning Infographics
.
Blog
.
<span class='date ' tip=''><i class='icon-time'></i> Jul 15, 2015 05:22pm</span>
|
|
The Truth About Brain Training Infographic
We’ve all seen the commercials: Work for minutes a day brain training online and you’ll become sharper, smarter and altogether happier with your mind. But do the games and exercises on these websites actually make you smarter? What about more traditional games like Sudoku and crossword puzzles? The Truth About Brain Training Infographic presents some scientific evidence regarding brain training.
Brain Myths
So many people these days are worried that their brain will deteriorate without "exercising" it; the truth is, regular stimulation and use are all that’s required to keep an active, healthy brain. In other words, just by being alive, you’re "exercising" your brain.
Myth 1: You use only 10% of your brain.
False. All different parts of your brain are required for everyday activities like breathing, eating, seeing and processing simple information.
Myth 2: Doing daily puzzles keeps your brain young.
False. There is no evidence-based research to suggest that things like daily crossword puzzles, Sudoku or brain-training exercises stave off dementia or keep your brain from aging any more than regular physical exercise or socializing with other people.
The Claims
Each brain-training website makes its own claims regarding its unique ability to "work out" your brain and make you smarter and better at daily brain activities.
"Several studies have been published on Lumosity’s ability to improve key abilities such as working memory, visual attention and executive function." - Lumosity.com
"Regular mental workouts of only 10-20 minutes daily can improve your cognitive function and brain processing speed." - Mybraintrainer.com
"You will find some brain fitness workouts that can help your mind process information more quickly, and more efficiently, as well as the ability to perform multiple tasks at the same time." - Brainmetrix.com
The Evidence
Many of these websites publish their own research and claim to have studies that back their activities as useful. For example … On its website, Lumosity states that "Since 2007, 7 studies have been published on the effects of Lumosity." The studies have involved Lumosity’s in-house researchers as well as outsiders.
The Murky Truth
Unfortunately, the few studies done outside of these websites have reached inconclusive results.
About 150: The number of studies published on brain training, though only a few tested benefits pertaining to real-life cognitive situations
A study at Georgia Tech found that playing "brain games" like memory exercises made participants better at that particular exercise, but did not transfer to better memory as a whole.
In another study at Cambridge, 11,430 participants trained weekly with tests designed to improve cognitive function and memory. Participants only received higher test scores due to familiarity and not transferable improved memory or function.
Via: www.degreelibrary.orgThe post The Truth About Brain Training Infographic appeared first on e-Learning Infographics.
eLearning Infographics
.
Blog
.
<span class='date ' tip=''><i class='icon-time'></i> Jul 15, 2015 05:19pm</span>
|
|
Why We Should All Learn Coding Infographic
The Why We Should All Learn Coding Infographic presents the importance of learning to code. Code is the stuff that makes most of the technology we use every day work. Enthusiasm for learning programming languages is on the rise. And coding is no longer the domain of self-taught savants or formal C.S. students. Students of all ages and disciplines are recognizing the benefits of being more code fluent. Plenty of free, in-browser online tutorials have risen to meet this need. One site, Codecademy, had over 1 million users pledge 2012 as their "code year" and sign up for their free tutorials on Java, HTML and CSS for beginners.
This is a great sign for the future of work in the U.S. Coding familiarity is becoming more of an asset across all industries. You don’t need to know how to reprogram your computer to operate it, but understanding how it works will help you imagine how programs can change to better serve your industry. So, if you’re among those of us who’ve always thought programming was impossibly hard or reserved for the tech-minded, consider learning a little code. There’s never been a better (or more supportive) time to get ahead of the curve.
Via: www.onlinecollege.orgThe post Why We Should All Learn Coding Infographic appeared first on e-Learning Infographics.
eLearning Infographics
.
Blog
.
<span class='date ' tip=''><i class='icon-time'></i> Jul 15, 2015 05:19pm</span>
|
|
Degrees in Education and Teaching Certificates Infographic
An education degree is designed to prepare the student for a career as an educator. The Degrees in Education and Teaching Certificates Infographic presents the latest data on education degrees and teaching certificates in the United States and details the current job outlook, the outlook over the next ten years, top salaries, and top degree types for education and teaching positions.
A Day in the Life of a Teacher
The individual workload for teachers depends mostly on the school’s location and the age of the students. Leadership in individual school systems and educational benchmarks can increase the level of regulation on the classroom, which can be frustrating to teachers. Some schools allow teachers to have mentors and team-teaching opportunities, but most teachers work alone with a changing group of students.
Types of Degree Programs
Bachelor
BS in Elementary Education - Mathematics
BS in Elementary Education - Social Studies
BS in Elementary Education - Science
BS in Elementary Education - English Language Arts
BS in Education - Elementary Education
Master
MA in Ed - Teacher Education - Mid Level Science
MA in Education - Teacher Education Secondary Mathematics
MA in Education - Teacher Education Middle Level Mathematics
MA in Education - Teacher Education Secondary Science
Doctorate
Educational Specialist
Ed.D. in Educational Leadership
Top 5 Career Available for this Degree
Elementary and Secondary Schools
Employment Services
Colleges, Universities, and Professional Schools
Local Government (OES Designation)
6 State Government (OES Designation)
Quick Facts
According to the US. Bureau of Labor Statistics (BLS), high school teachers, including history teachers, held 1.1 million jobs in 2008. The BLS also reported that employment opportunities were expected to grow by nine percent between the years 2008-2018, though this growth would be dependent on various levels of education spending in each state and locality.
According to the US Bureau of Labor Statistics, elementary school teachers held 1.5 million jobs in 2008. Employment is projected to increase by 16% to 1,793,700 jobs in 2018. Also, many job openings will be spurred by the retirement of present-day teachers, as noted by the College Board. According to the College Board, nearly half of all teachers were over the age of 45 in 2006. Public schools, however, need funding from the government in order to hire more teachers, which may require local or state legislation, according to the BLS.
Via: degreecouncil.orgThe post Degrees in Education and Teaching Certificates Infographic appeared first on e-Learning Infographics.
eLearning Infographics
.
Blog
.
<span class='date ' tip=''><i class='icon-time'></i> Jul 15, 2015 05:19pm</span>
|
|
The Top eLearning Statistics And Facts For 2015 Infographic
To find out more please visit: The Top eLearning Statistics and Facts For 2015 You Need To Know
Countless reports, surveys, and studies have shown that eLearning industry isn’t showing any signs of slowing down. In fact, an increasing number of individuals, corporations, and institutions are turning to eLearning as they recognize its effectiveness and its convenience. Here are some important eLearning statistics and facts for 2015, some of which may even surprise you!
The Global eLearning Industry Market.
The global eLearning Market is expected to reach $107 billion by 2015 [5]. The global self-paced eLearning market reached $32.1 billion in revenue in 2010 [3], with a five year compound annual growth rate of approximately 9.2%. This means that the self-paced eLearning market should see estimated revenues of $49.9 billion in 2015 [3].
Top 10 Growth Rates By Country.
Growth rate shows how each country adopts eLearning and is a significant indicator since it can reveal revenue opportunities. The growth rate of self-paced eLearning by country is [3]:
India: 55%
China: 52%
Malaysia: 41%
Romania: 38%
Poland: 28%
Czech Republic: 27%
Brazil: 26%
Indonesia: 25%
Columbia: 20%
Ukraine: 20%
Learning Management System Market.
The LMS market was worth $2.55 billion in 2013 with an estimated compound annual growth rate of approximately 25.2% [2]. In other words, the LMS market is expected to worth approximately $4 billion in 2015 and over $7 billion in 2018. The highest proportion of revenue contribution is expected to be generated in North America.
Mobile Learning Market.
The worldwide market for Mobile Learning products and services reached $5.3 billion in 2012 [7]. With a compound annual growth rate of 18.2% for the next five years, it is estimated that the worldwide mobile learning market in 2015 will reach $8.7 billion and it will even reach $12.2 billion by 2017. It is worth to note that while in 2012 the top buyers of mobile learning products and services where US, Japan, South Korea, China, and India, it is expected that by 2017 the top buyers of mobile learning products and services will be China, US, Indonesia, India, and Brazil.
MOOCs in Corporate Training.
Currently 8% of companies use MOOCs, while another 7% consider to experiment with MOOCs. It is predicted that in the following two years this percentage will rise to 28% [4].
Examples:
more than 350 companies cooperate with Coursera and Udacity to identify the best students that would probably make the best possible candidates for relevant jobs [8].
Google has already enrolled 80,000 of its employees in Udacity’s HTML5 course [8].
Online Corporate Training.
The online corporate market is expected to grow by 13% per year up to 2017. Today, 77% of USA companies offer online corporate training to improve the professional development of their employees [9].
eLearning Top Buyers.
Large companies are the main purchasers of eLearning products and services. As a matter of fact, these companies make up roughly 30% of all eLearning buyers [1].
Corporate Training Delivery Methods.
The training delivery methods for 2014 were as follows [6]:
47% of training hours were delivered by instructor led classroom only setting- increased by 3% as compared to previous year
29.1% of training hours were delivered with blended learning methods- increased by 0.8 as compared to previous year
28.5% of training hours were delivered via online or computer based technologies (no- instructor)- increased by 2.6% as compared to previous year
15% of training hours were delivered via virtual classroom/ webcast only (instructor from remote location)- decreased by 1% as compared to previous year
4.2% of training hours were delivered via social learning- increased by 0.9% as compared to previous year
1.4% of training hours were delivered via mobile devices- decreased by 0.5 as compared to previous year.
Learning Technologies
The learning technologies used for 2014 were as follows [6]:
74% of companies currently use Learning management systems (LMS) and Virtual classroom/ webcasting/ video broadcasting
48% of companies currently use Rapid eLearning Tool (ppt conversion tool)
33% of companies currently use Application simulation tool
25% of companies currently use Learning Content Management System
21% of companies currently use Online performance support or knowledge management system
18% of companies currently use Mobile Applications
11% of companies currently use Podcasting.
Demand of eLearning Software And Services in 2015.
The following statistics present what the small, mid-sized and large companies intent to purchase in 2015, based on the 2014 Training Industry Report [6].
44% of companies intent to purchase online learning tools and systems
41% of companies intent to purchase Learning Management Systems (LMSs)
37% of companies intent to purchase authoring tools/systems
33% of companies intent to purchase classroom tools and systems
29% of companies intent to purchase content development products and services
27% of companies intent to purchase courseware design and presentation tools and software
18% of companies intent to purchase audio and web conferencing products and systems.
Do you believe that it is high time to become an eLearning professional? Read the Free eBook How To Become an eLearning Professional which is filled with the knowledge, wisdom, experience, and inspiration of carefully selected eLearning professionals.
Via: elearningindustry.comThe post Top eLearning Stats and Facts For 2015 Infographic appeared first on e-Learning Infographics.
eLearning Infographics
.
Blog
.
<span class='date ' tip=''><i class='icon-time'></i> Jul 15, 2015 05:18pm</span>
|
|
Parents Helping Kids with Homework Infographic
Helping kids with home assignments appears to be dogmatic in the US educational system. Thus, many working parents face some troubles, but are still active in their kids’ studying lives. The Parents Helping Kids with Homework Infographic presents some directives of the US educational system on how parents should help their kids with homework. Let’s see what they’ve found out!
Facts and Stats
43% of parents help kids with homework
53% of them do it every day a
47% of dads
39% of moms
English and Math are the most popular subjects parents help kids with.
Younger parents care less about their kids’ homework, while elder ones pay more attention to the children’s studies: 33% of parents aged 18-24 help kids with home assignments and 45% of parents aged 25-44 do the same.
5 out of 10 parents claim that they experience troubles while helping their kids with homework
One in five parents said they were regularly surprised by the difficulty of the work their children brought home to complete
Seven out of 10 said they would spend more time helping with homework if they were more confident in their own abilities in maths and English.
More than nine out of 10 parents agreed that helping their children at home made a difference to their academic achievements at school.
2% of parents say that they’ ve never helped their kids with homework
31,6% of parents say their kids refuse to get help from them
21% of parents say they are too busy
45,5% say they don’t understand the material
1 out of 6 families does all the homework for its kids
Students with two active-in-studies parents are happy at school 52% more than the ones with two passive parents.
On average, students with active-in-studies parents get A’s 51% more than the ones with two passive parents
5 Tips to Help a Child with Homework
Set the regular homework-time
Choose the right place for homework
Get rid of all the possible distractions
Prepare materials and show the resources
Be the vivid example: interested and interesting
View also:
5 Ways to Make Homework Fun for Kids Infographic
8 Ways To Help Children With Homework Infographic
Via: www.homework-desk.comThe post Parents Helping Kids with Homework Infographic appeared first on e-Learning Infographics.
eLearning Infographics
.
Blog
.
<span class='date ' tip=''><i class='icon-time'></i> Jul 15, 2015 05:18pm</span>
|
|
The Evolution of Learning Technologies Infographic
Human beings have always been seekers of knowledge. Since the beginning of recorded history (and probably before) we have always strived to discover the mysteries of the planet, of Earth and of ourselves. The Evolution of Learning Technologies Infographic presents how learning has evolved over the course of human history and what might the future hold for us.
Hieroglyphics
Egyptian hieroglyphs combined logographic and alphabetic symbols on papyrus and wood. Discovered as early as 3400 BC, hieroglyphics indicated that there had been an education system as ancient times.
Abacus
Herodotus first wrote about the abacus in 480 BC. The ancient Egyptians also used it as a counting mechanism and for trade. The earliest surviving abacus, the Salamis Tablet, is from around 300 BC and was used by the Greeks.
First computer
You may not have realised it but several analogue computers were constructed in ancient times to perform astronomical calculations. These include the Antikythera mechanism and the astrolabe. These devices contributed to the education of society and to the knowledge base of the Greeks.
Quill pen
Introduced around 700 AD, the quill is a pen made from a bird feather. The strongest quills were those taken from living birds in the spring from the five outer left wing feathers.
The Renaissance
The Renaissance was a cultural movement that spanned the period roughly from the 14th to the 17th century, beginning in Italy in the Late Middle Ages and later spreading to the rest of Europe. Education and new ideas abounded and education spread like wildfire. Emphasis was placed on art, and the classics of Greek and Roman knowledge.
Printing press
German Johannes Gutenberg invented the printing press around 1450. A goldsmith by profession, he developed a printing system by adapting existing technologies and making inventions of his own. His new invention made copying documents much easier and accessible to more people.
Pencil
In 1795 Nicholas Jacques Conte, an officer in Napoleon’s army, discovered a method of mixing powdered graphite with clay and forming the mixture into rods that were fired in a kiln. This improved on technology discovered by a Czech manufacturer called Koh-i-Noor Hardtmuth. They were one of the world’s largest producers and distributors of pencils, pens, and art supplies.
First correspondence school
In 1873, Anna Eliot Ticknor founded the Society to Encourage Studies at Home, a network of women teaching fellow women through the mail. In 1875 a lending library was established for the members of the Society which eventually served about 10 000 members until 1897. Learning by distance was seen to be a great way to get skills that you wouldn’t have otherwise had.
The first calculator
To help educate people about numbers, the first mechanical calculator called the Yazu Arithmometer was patented in Japan in 1903.
First stored-program computer
The Manchester ‘Small-Scale Experimental Machine’, nicknamed ‘Baby’, was the world’s first stored-program computer. It was built at the Victoria University of Manchester and ran its first program on 21 June 1948. Baby was a whopping-great thing, it took up a whole room!
The Dynabook
The concept of mobile learning as we are familiar with it today originated in 1968 when Alan Kay conceived the KiddiComp (later renamed Dynabook), a portable, lightweight, battery-operated networked computer with a colour graphical display. While the device was never actualised, many concepts and products came as a result of this original idea.
E-textbook
In 1971, Michael Hart scans and publishes the Declaration of Independence on the internet as the first document of what would eventually become Project Gutenberg, the first digital library in the public domain.
Apple II
The Apple II was released in 1977 and featured Visicalc (Apple’s proprietary spreadsheet) and educational games such as Oregon Trail. Apple also allowed Bell and Howell (a school equipment supplier) to distribute the Apple II to schools. In 1979 the Apple Education Foundation was established, which granted complete Apple II systems to schools.
Tablet computer
The GRiDPAD was released in 1989 and featured a touch-sensitive LCD with an on-screen keyboard and handwriting recognition technology to facilitate writing with the attached stylus. It also had internet capability and could accommodate speakers for music playback.
Smartphone
Named Simon as it was supposed to be ‘simple’, the IBM Simon, released in 1994, is regarded as the first smartphone. It had a monochrome touchscreen, was able to make calls, send text messages, send emails, had a calculator, calendar and world clock and fax capabilities. It also had the ability to accommodate a camera, maps, and music playback.
Google
Google began in January 1996 as a research project, spearheaded by Larry Page and Sergey Brin while they were both still students. It was different from other existing programs, as it had a very simple design.
MOOC (Massive Open Online Course)
In 2008, Stephen Downes and George Siemens launched an open online course entitled ‘Connectivism and Connective Knowledge’ that was presented to 25 tuition fee-paying students in Extended Education at the University of Manitoba. Over two thousand students also took the online class free of charge. This is widely recognised as the first MOOC.
Wearable tech
2013 saw the limited release of Google Glass, the first mass-produced wearable device providing an augmented reality platform and cloud access to the user. The possibilities for educational activities utilising Google Glass are beginning to take shape.
Brain implants
Wearable technology will be replaced by permanent or temporary implants in the ears and eyes that allow direct interface with computers and the internet. Computer implants are capable of augmenting natural senses and enhancing higher brain functions like memory, learning speed and overall intelligence.
3D printers
3D printing may use various processes to make a three-dimensional object. In 3D printing additive processes are used and successive layers of material are laid down under the control of a computer. These objects can be of almost any shape or geometry, and may even include food products!
Robots
Intelligent beings can now instantly acquire knowledge and skills by downloading them directly. Skills such as knowledge of foreign languages and the ability to play musical instruments or perform complex tasks (like operating machinery or performing surgery) are now accessible to anyone. The process of learning is compressed into an instantaneous affair instead of the years-long struggle normal humans experience.
What will the future bring us?
Time and learning does not stand still, it will continue to evolve and change as we develop new relationships with ourselves and our environments. What will the future bring us? Will human beings continue to discover new, innovative knowledge and grow, inventing new technologies and harnessing more of the Earth’s natural powers? Only time will tell, but do you care to adventure a guess? What does the future of learning hold for us?
Via: www.opencolleges.edu.auThe post The Evolution of Learning Technologies Infographic appeared first on e-Learning Infographics.
eLearning Infographics
.
Blog
.
<span class='date ' tip=''><i class='icon-time'></i> Jul 15, 2015 05:17pm</span>
|
|
Top 5 LMS Benefits for Students Infographic
Learning Management Systems save companies and instructors valuable time and money by enabling them to easily manage the training of large groups of learners through a web-based environment with anytime, anywhere accessibility. The Top 5 LMS Benefits for Students Infographic presents 5 ways in which learning management systems benefit students.
1. Access to information anytime, anywhere
Students can get access to study materials from anywhere and at any time.
Most modern LMSs have mobile apps that allow students to engage with e-learning content on any device.
2. Centralized information
All study materials are consolidated in one location.
Students can quickly exchange various resources.
3. Increased communication
Students can collaborate on different tasks.
Students can make connections and exchange opinions with others.
Students stay updated with the latest news from teachers and friends.
4. Studying becomes more enjoyable
Students can study at their own pace, especially if your LMS has support for self-paced classes.
Rich and engaging content makes learning more effective and students more involved.
5. Time saving
Students can rapidly find important and relevant material.
Students can submit assignments with just one click.
Fast and extensive updates on their learning progress.
Via: www.neolms.comThe post Top 5 LMS Benefits for Students Infographic appeared first on e-Learning Infographics.
eLearning Infographics
.
Blog
.
<span class='date ' tip=''><i class='icon-time'></i> Jul 15, 2015 05:14pm</span>
|
|
MOOCs: Expanding the Scope of Organizational Learning Infographic
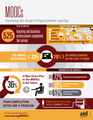
During the past half-decade, massive, open, online courses (MOOCs) have brought significant upheaval to the world of academia, while extending educational opportunities to students who might never gain access to university classes by traditional means. The affordability (often free), flexibility, and collaborative aspects of these electronically delivered learning options have driven the popularity and expansive growth of MOOCs as an alternative in higher education. Now the disruptive approach is knocking on the doors of corporate learning functions.
On a most basic level, MOOCs provide an inexpensive means of expanding learning opportunities. For organizations challenged to deliver consistent learning to workforces increasingly spread over vast geographies, MOOCs offer a welcome departure from travelintensive and costly instructor-led training. Enhancing access to e-learning, and adding to leadership and high-potential employee development are a few of the additional anticipated benefits associated with MOOC use by organizational learning functions.
The Association for Talent Development (ATD, formerly ASTD) and the Institute for Corporate Productivity (i4cp) collaborated on MOOCs: Expanding the Scope of Organizational Learning research report designed to explore the current—and anticipated—use of MOOCs in the business world. This Study explores some of the most compelling questions about MOOCs and the promise (and challenges) they hold for organizational learning function, which include:
Are companies leveraging MOOCs for employee learning? Are they doing so effectively?
How are learning professionals becoming informed about this new approach?
Do organizations actively encourage their employees to participate in MOOCs?
Are MOOCs a passing fad in organizational learning, or are they on the brink of significant growth?
Will the poor completion rates plaguing MOOCs in higher education hobble corporate learning?
ATD and i4cp found professionals worldwide voicing similar enthusiasm—a clear signal that the learning function is eager to explore the contributions MOOCs can make in the corporate environment.
View also:
How Corporations Use MOOCs Infographic
Via: www.td.orgThe post MOOCs: Expanding the Scope of Organizational Learning Infographic appeared first on e-Learning Infographics.
eLearning Infographics
.
Blog
.
<span class='date ' tip=''><i class='icon-time'></i> Jul 15, 2015 05:13pm</span>
|
|
Designing eLearning Courses Backwards Infographic
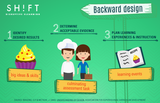
Courses developed in the traditional manner only impart knowledge. They are loaded with definitions and concepts and are probably accompanied by a list of scenarios or situations where these can be applied. The learners are expected to learn these by heart. To impart understanding, you, as an instructional designer, have to design your course around the outcomes or the performance you expect to elicit from the learners. That is, you have to start with the learner. Backward designing approach is unlike how traditional eLearning courses are created where the sole focus is on delivering the content and developers do not consider if the learners can digest what they are gulping down. The Designing eLearning Courses Backwards Infographic presents a Framework to start designing e-courses backwards.
3 Stages of Backward eLearning Design
Backward design is a purely purpose-driven process, and neither you nor your learners will ever be in the dark about the whys, wherefores, and the how-to’s of the course. T he design process involves you plan in 3 stages, each with a focusing question:
Stage 1: Identify Desired Outcomes
Key Questions:
What is worthy and requiring of understanding?
What do we expect students to learn?
Backward Design focuses on the needs of the learner. The learner is expected to perform certain tasks or demonstrate a specific skill. The course you develop should help him develop those skills or empower him to perform some specific tasks. These are the learning outcomes or the overarching objectives of the course.
Stage 2: Define Assessment Tasks
Key Questions:
What is evidence of understanding?
How will we know if students have achieved the desired results?
When you design an eLearning course backwards, you strive to create the perfect learner experience. Unlike courses designed the traditional way, backwardly-designed courses contain ample opportunities for the learner to evaluate their learning (and feel assured they are on the right track). Instructional designers create assessment activities to measure the understanding of the learners. Well-designed and "empathetic" courses provide customized learning experiences based on the results of these assessment tasks.
Stage 3: Design the Learning Experience
Key Questions:
What learning experiences promote understanding?
What activities will lead to achievement of the desired results and success at the assessments?
This process is smooth sailing if you carry out the previous two steps diligently. You know the learning outcomes you are striving for. You know how to test the understanding of the learners. So now all that remains is to design the learning activities.
Via: info.shiftelearning.comThe post Designing eLearning Courses Backwards Infographic appeared first on e-Learning Infographics.
eLearning Infographics
.
Blog
.
<span class='date ' tip=''><i class='icon-time'></i> Jul 15, 2015 05:11pm</span>
|